Demystifying the Logarithm: A Comprehensive Guide for Data Professionals and Analysts

The professional landscape of data science and business intelligence is frequently navigated by individuals whose formal academic backgrounds in mathematics are limited to foundational arithmetic, algebra, and geometry. As the industry evolves toward increasingly complex data structures, the necessity to grasp abstract mathematical concepts—specifically logarithms—has become a prerequisite for accurate data interpretation. Despite their importance, logarithms are often perceived as impenetrable, leading to widespread confusion among practitioners who must apply them in data visualization and statistical analysis.

Defining the Logarithm: A Fundamental Mathematical Framework
At its core, a logarithm is the inverse operation of exponentiation. To define it simply, the logarithm of a number is the exponent to which a fixed base must be raised to produce that specific number. For instance, in the equation log₁₀(100) = 2, the base is 10, and the value is 2 because 10 raised to the power of 2 (10 * 10) equals 100.
Historically, the concept of logarithms emerged in the early 17th century, pioneered by John Napier. His work was designed to simplify complex calculations by transforming multiplication into addition, a revolutionary shift for the astronomers and navigators of the era. Today, while computational power has rendered manual logarithmic calculations largely obsolete, the conceptual utility of logarithms remains vital in fields ranging from decibel measurement in acoustics to seismic magnitude scales in geology.

Chronology of Mathematical Understanding
The development of a data professional’s mathematical fluency often follows a predictable trajectory. In the early stages, most practitioners rely on intuition and basic linear models. However, as datasets grow in scale, the limitations of linear thinking become apparent.
- Foundational Education (Primary/Secondary School): Exposure to basic arithmetic and algebra. At this stage, the practical application of logarithms is rarely contextualized for real-world data analysis.
- Professional Entry (The "On-the-Job" Phase): Data professionals often encounter logarithmic scales when visualizing skewed data. Without a conceptual bridge, many analysts mistakenly assume that sequences like 1, 10, 100, and 1,000 are themselves logarithms, rather than the numbers from which logarithms are derived.
- Advanced Synthesis (The Mastery Phase): The ability to distinguish between exponential growth, linear progression, and logarithmic growth. This stage marks the transition from basic data reporting to high-level analytical sensemaking.
Analyzing Logarithmic Scales vs. Logarithmic Growth
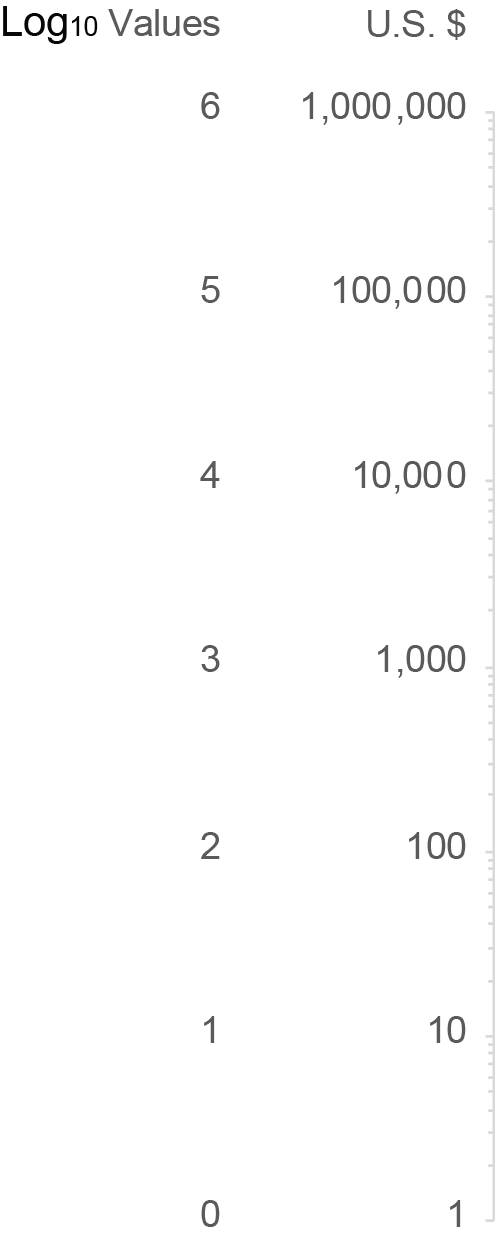
A common point of contention in data visualization is the distinction between logarithmic scales and logarithmic growth. A logarithmic scale is a graphical tool used to display data that spans several orders of magnitude. On a standard linear scale, intervals are equal in value (0, 10, 20, 30). On a logarithmic scale, however, intervals represent equal ratios. For example, a log₁₀ scale might display segments where each tick mark is ten times the previous one. This compression allows analysts to visualize data points that vary from the single digits into the millions on a single, readable chart.

Conversely, logarithmic growth refers to a mathematical phenomenon where a quantity increases, but the rate of that increase consistently diminishes over time. This is distinct from exponential growth, where the amount of increase grows larger with each subsequent period. In the context of physics, the path of a projectile provides a classic, real-world example: as an object is launched into the air, its altitude increases rapidly at first, but the rate of that gain slows significantly due to gravity until it reaches its apex.
Supporting Data and Comparative Analysis
To visualize these differences, one must compare the patterns of growth across three primary modes:
- Linear Growth: Characterized by a constant rate of change. The slope of the line remains uniform throughout the data series.
- Exponential Growth: Characterized by an accelerating rate of change. This is frequently observed in compound interest calculations or viral population growth, where the growth rate is proportional to the current value.
- Logarithmic Growth: Characterized by a decelerating rate of change. As the input increases, the logarithmic output grows at an increasingly slower pace.
The implications for data analysts are significant. When a data professional plots exponentially growing data on a logarithmic scale, the resulting graph appears as a straight line. This transformation is a powerful diagnostic tool, as it allows for the identification of trends that would otherwise be obscured by the extreme steepness of exponential curves.
Industry Implications and Expert Consensus
The broader impact of this mathematical literacy cannot be overstated. According to industry experts in data visualization, the misuse of log scales is one of the most common errors in business intelligence reporting. A report by the Data Visualization Society noted that when analysts apply log scales to datasets that do not warrant them—or fail to label them clearly—stakeholders are prone to misinterpreting the velocity of growth, often leading to flawed strategic decisions.

"The goal of effective data communication is to provide clarity, not confusion," says an independent data consultant. "Understanding the underlying math of the tools we use is the only way to ensure that our visualizations represent reality rather than distorting it."
The Strategic Value of Mathematical Fluency
For the modern data professional, the study of logarithms is not merely an academic exercise; it is an essential component of professional competence. As Big Data continues to dominate the corporate and research sectors, the capacity to process, visualize, and interpret information across varying scales is a critical skill.
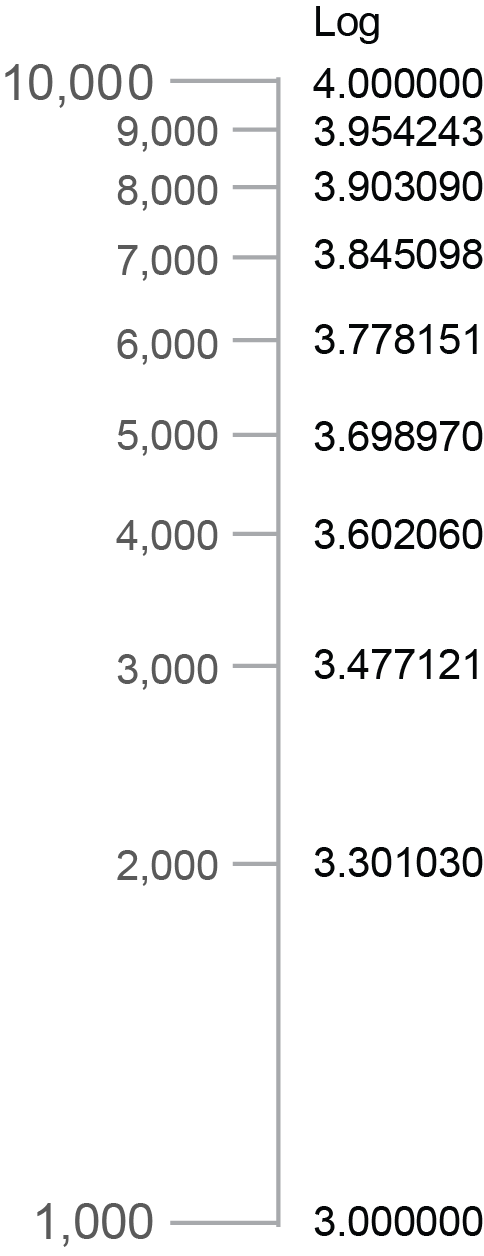
The relationship between logarithms and exponential power is inverse. When one understands that the log scale is essentially a mapping of powers, the "mysterious" nature of these charts dissolves. By recognizing that logarithms provide a way to compress vast ranges of data into a manageable visual space, practitioners can better communicate complex trends to non-technical stakeholders.
In conclusion, while the average data analyst may not need to perform complex logarithmic proofs on a daily basis, the conceptual mastery of these tools is foundational. It prevents the common pitfalls of misleading data presentation and enhances the overall rigor of analytical reporting. Whether one is dealing with financial metrics, scientific research, or user engagement statistics, the ability to discern between exponential and logarithmic behavior remains a hallmark of an advanced, reliable, and highly effective data professional. By bridging the gap between formal education and practical application, the industry continues to move toward a more accurate and nuanced understanding of the data that drives our modern economy.