
-
Search Engine Optimization

Mastering Topical Authority: Why Strong Brands Like Great Jones Struggle in AI Search and How to Win
Even highly recognized brands, celebrated for their quality products and extensive media coverage, can find themselves overlooked in the era…
Read More » -
Search Engine Optimization

Google’s John Mueller Illuminates Critical Robots.txt Precedence Error Impacting Website Indexing and SEO Goals
Google’s John Mueller recently provided crucial clarification regarding a common, yet often overlooked, misconfiguration within robots.txt files that can severely…
Read More » -
Digital Marketing Strategy

Marketing’s AI Paradox: Widespread Adoption Meets Operational Chaos as Efficiency Goals Remain Elusive
A recent Optimizely survey involving over 2,000 B2B marketers worldwide has unveiled a significant paradox in the realm of artificial…
Read More » -
Digital Marketing Strategy
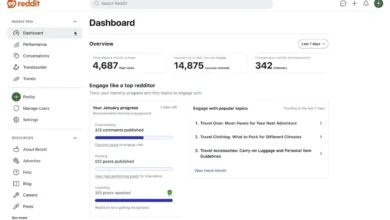
Optimizing Holiday Promotions: Leveraging Reddit for Enhanced Brand Reach and Sales in H2 2026
As marketers meticulously plan their strategies for the second half of 2026, the critical period encompassing major holiday promotions looms…
Read More » -
Blogging and Content Creation

Unlocking Blogging Potential: Eight Strategic Steps to Cultivate Writing Confidence
The journey into blogging, whether driven by aspirations for financial independence, business growth, professional recognition, a creative outlet, or global…
Read More » -
WordPress Ecosystem

Bolstering Internet Security Through Cross-Industry Collaboration: The Secure Hosting Alliance and Internet Infrastructure Forum Lead the Charge
The critical imperative of strengthening internet security through concerted cross-industry collaboration took center stage on the WP Tavern’s Jukebox Podcast,…
Read More » -
WordPress Ecosystem

Leveraging AI Coding Agents for WordPress Management: The Indispensable Role of Developer-Friendly Hosting
The landscape of WordPress site management is undergoing a significant transformation, with artificial intelligence emerging as a pivotal force. While…
Read More » -
WordPress Ecosystem

Migrating WordPress Sites to Pressable: A Comprehensive Overview of Managed Hosting Benefits and Seamless Transitions
Published on January 9, 2026 The digital landscape, increasingly reliant on robust and scalable online presences, continues to drive demand…
Read More » -
WordPress Ecosystem

Google’s E-E-A-T Guidelines: How to Show Experience in Content
Google’s continuous refinement of its search algorithms has once again reshaped the landscape of digital content, introducing a critical update…
Read More » -
Social Media Marketing

Mastering Social Media Management for Startups: A Strategic Imperative for Growth
Managing a nascent startup business is an all-consuming endeavor, demanding the lion’s share of founders’ time and resources to meticulously…
Read More »
