
The core premise of the updated edition rests on the distinction between data visualization as a presentation tool and data visualization as a cognitive process. While the first edition focused heavily on the foundational principles of using graphs to find patterns, the second edition expands this scope to include sophisticated techniques such as Statistical Process Control (SPC). This integration reflects a shift in the industry toward a more rigorous, evidence-based approach to business intelligence and scientific research, where the primary goal is not merely to show data, but to derive actionable meaning from it.
The Evolution of Visual Data Sensemaking
To understand the significance of this release, it is essential to examine the chronology of Stephen Few’s contributions to the field. Few, the founder of the consultancy Perceptual Edge, has long been a vocal advocate for the application of Gestalt principles and cognitive psychology in data design. His journey began to gain international prominence with the 2004 release of Show Me the Numbers, which established best practices for table and graph design.
In 2009, the first edition of Now You See It was published, filling a critical gap in the market. At that time, most literature focused on how to present data to an audience. Few’s work was among the first to focus on the discovery phase—how an analyst uses visual tools to explore data for their own understanding. However, as data sets grew in complexity and the "Big Data" era took hold, the need for more robust statistical foundations became apparent. This led to the 2015 publication of Signal, which introduced deeper mathematical concepts to help analysts distinguish between random variation (noise) and meaningful trends (signal).
The 2021 second edition of Now You See It represents the culmination of this twenty-year trajectory. By distilling the essential components of both the 2009 and 2015 texts into a single, cohesive volume, the author addresses the modern analyst’s need for efficiency. Despite the addition of advanced material from Signal, the new edition maintains a manageable physical profile, achieved through rigorous editing and the removal of redundant concepts, ensuring the text remains an accessible guide rather than an intimidating academic tome.
Bridging the Gap Between Vision and Logic
A central theme of the revised text is the utilization of human vision as the primary engine for data analysis. The book argues that while automated algorithms and machine learning have their place, the human eye remains the most powerful tool for detecting patterns, trends, and outliers when data is presented correctly.
The human visual system is evolved to identify relationships in space and color instantaneously. Visual data sensemaking leverages this biological hardware by converting abstract numbers into physical shapes. The second edition provides updated frameworks for this conversion, emphasizing that the process must be interactive. Sensemaking is described as a dialogue between the analyst and the data, where one observation leads to a new question, which is then answered through a different visual filter.
By incorporating Statistical Process Control (SPC) into this visual framework, the book provides a bridge between intuitive observation and statistical rigor. SPC, originally developed for manufacturing quality control, is presented here as a universal tool for understanding "variation." This is a critical addition for modern business environments where distinguishing between a one-time anomaly and a systemic change is the difference between a successful pivot and a costly mistake.
Supporting Data: The Growing Need for Analytical Literacy
The release of this second edition comes at a time when the global volume of data is expanding at an exponential rate. According to industry reports from the International Data Corporation (IDC), the Global DataSphere—a measure of data created, captured, copied, and consumed—is expected to reach 175 zettabytes by 2025. Despite this explosion of information, studies by firms such as Gartner suggest that a vast majority of corporate data remains "dark data," or information that is collected but never analyzed.
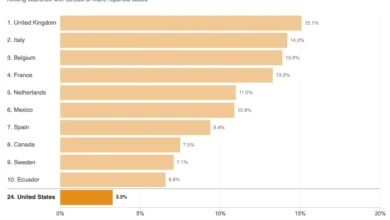
Furthermore, a 2020 survey on data literacy conducted by the Data Literacy Project revealed that only 24% of global employees feel fully confident in their ability to read, work with, analyze, and argue with data. This "data literacy gap" creates a bottleneck in decision-making processes. Few’s work addresses this specific deficit by arguing that the barrier to entry is not a lack of expensive software, but a lack of fundamental sensemaking skills.
The second edition of Now You See It is positioned as a solution to this literacy crisis. By focusing on "low-tech, high-thought" methods, the book empowers individuals to perform high-level analysis using standard tools like Excel or basic BI platforms, provided they understand the underlying principles of visual perception and statistical significance.
Industry Reactions and Professional Implications
While the announcement of the second edition was primarily a literary event, it resonated across the data science and business intelligence communities. Analysts have noted that Few’s emphasis on "sensemaking" serves as a necessary counterweight to the current industry obsession with Artificial Intelligence (AI) and automated "black box" analytics.
Industry experts suggest that the integration of Signal into Now You See It reflects a maturing of the data visualization field. In the early 2010s, the focus was often on "infographics" and aesthetic appeal. Today, there is a renewed demand for accuracy and depth. Professionals in fields ranging from healthcare to finance have expressed a need for methodologies that can handle the "noise" of modern data streams without requiring a PhD in statistics.
The revised subtitle, An Introduction to Visual Data Sensemaking, is also seen as a strategic move to define the discipline. By moving away from the more generic "Visual Analysis," Few clarifies the objective: the goal is "sensemaking," a term borrowed from cognitive psychology that describes the process by which people give meaning to their experience. In a corporate context, this means transforming raw metrics into a coherent narrative that can inform strategy.
Analysis of Broader Impacts
The long-term impact of this publication is likely to be felt in how data analysis is taught and practiced in professional settings. By consolidating his theories, Few has created a standardized curriculum for visual sensemaking that is both comprehensive and efficient.
One of the most significant implications of the new edition is its democratization of advanced techniques. Statistical Process Control was once the domain of specialized engineers; by presenting it through a visual lens, Few makes it accessible to marketing managers, human resource professionals, and school administrators. This "democratization of the signal" allows for more nuanced decision-making at all levels of an organization.
Moreover, the book serves as a critique of modern software trends. Many contemporary data tools prioritize "one-click" visualizations that often obscure the truth or lead to "chartjunk"—visual elements that distract from the data. Few’s updated work reinforces the idea that the tool is secondary to the analyst’s skill. This perspective is increasingly relevant as companies realize that investing in expensive software does not automatically result in better insights if the staff lacks the foundational skills to interpret the output.
Conclusion and Future Outlook
As the world continues to grapple with the complexities of the digital age, the ability to discern meaning from chaos becomes a vital survival skill. The second edition of Now You See It: An Introduction to Visual Data Sensemaking provides a timely and necessary update to a foundational text. By streamlining the path from basic visualization to advanced statistical understanding, Stephen Few has provided a roadmap for the next generation of data-literate professionals.
The publication stands as a reminder that in an era of increasingly complex algorithms, the most effective way to understand the world remains the oldest: looking closely, thinking clearly, and seeking the signal amidst the noise. As organizations continue to seek ways to turn their data into a competitive advantage, the principles outlined in this volume will likely remain the gold standard for visual data analysis for years to come. The April 15, 2021, release date thus marks not just the update of a book, but the reinforcement of a philosophy that prioritizes human intelligence in the face of the data deluge.


