The Statistical Mirage: Why Daily COVID-19 Case Counts Can Mislead Financial Markets and Public Health Policy

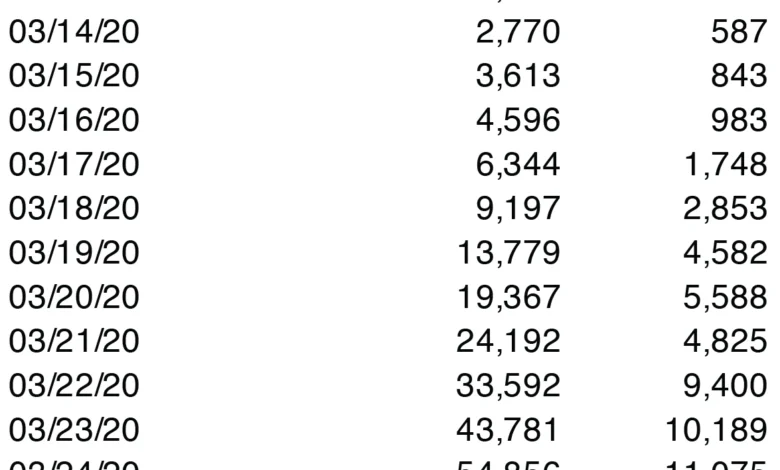
On April 6, 2020, the Dow Jones Industrial Average experienced one of its most significant single-day surges in history, gaining 1,627.46 points, or approximately 7.73 percent. This aggressive rally was largely attributed to a perceived stabilization in the spread of COVID-19 within the United States. Investors and analysts pointed to a specific data point: reported new coronavirus cases had dropped from a record high of 34,196 on Saturday, April 4, to 25,316 on Sunday, April 5. This represented the first recorded decline in daily new cases since March 21, leading many to believe that the pandemic had finally "turned the corner." However, a deeper analysis of statistical reporting methods, data volatility, and the inherent lags in medical infrastructure suggests that this optimism was premature and based on a fundamental misunderstanding of how public health data is collected and reported.
The reliance on daily case counts as a barometer for the pandemic’s trajectory highlights a critical tension between the speed of financial markets and the slow, often messy reality of epidemiological data. While the stock market reacts in real-time to headlines, the process of testing, recording, and reporting a viral infection is subject to numerous delays and administrative variables. In the early stages of the COVID-19 pandemic, these variables created significant "noise" in the data, leading to fluctuations that did not necessarily reflect the actual rate of new infections. Understanding why these daily figures are unreliable requires an examination of the reporting chain and the statistical tools used to smooth out volatile datasets.
A Chronology of Data Volatility in Early 2020
To understand the context of the April 6 market rally, one must look at the progression of the pandemic in the United States throughout the early spring of 2020. In March, the country moved from isolated outbreaks to a full-scale national crisis. By mid-March, most states had implemented stay-at-home orders, and the economic impact was immediate, with the stock market entering a period of extreme volatility characterized by several "circuit breaker" halts.

By early April, the focus had shifted from the arrival of the virus to the timing of the "peak." Both the White House Coronavirus Task Force and various financial institutions were scrutinizing daily reports from the Centers for Disease Control and Prevention (CDC) and state health departments to identify a plateau in the infection curve.
On Friday, April 3, the U.S. saw a sharp increase in reported cases, which appeared to continue into Saturday. When the numbers for Sunday, April 5, were released showing a drop of nearly 9,000 cases compared to the previous day, it triggered a relief rally. Investors interpreted the "Sunday dip" as a sign that social distancing measures were working faster than anticipated. However, by Monday, April 6, when more comprehensive data was processed, it became clear that the upward trend remained intact. The "peak" on April 3 was an illusion created by reporting delays; the actual number of infections was still climbing, and the apparent decline was merely a temporary lull in the administrative processing of test results.
The Infrastructure of a Pandemic: Why Data Lags
The discrepancy between the date an infection occurs and the date it is reported is one of the most significant hurdles in real-time pandemic tracking. Several factors contribute to this lag, making daily case counts an inaccurate "proxy" for the actual spread of the virus.
First, there is the biological lag. The incubation period for COVID-19 can range from two to 14 days. An individual infected on a Monday might not show symptoms until the following weekend. Consequently, the data reported on any given day reflects infections that likely occurred one to two weeks prior.

Second, the testing infrastructure in April 2020 was severely strained. During this period, the United States faced a shortage of testing kits and personal protective equipment (PPE). Many individuals with mild to moderate symptoms were encouraged to stay home without being tested to preserve resources for the critically ill. This meant that the official case counts only represented a fraction of the total infected population—specifically, those who were sick enough to seek hospital care or those who had access to limited testing sites.
Third, the administrative reporting process introduces "noise." When a test is administered, the sample must be sent to a laboratory, processed, and the results sent back to the healthcare provider. From there, the positive result must be reported to the local or state health department, which then forwards the data to the CDC. Each step in this chain can take hours or days. Furthermore, reporting is not consistent throughout the week. Many laboratories and administrative offices operate with reduced staff on weekends, leading to a consistent pattern where reported cases drop on Sundays and Mondays, only to "spike" on Tuesdays and Wednesdays as the backlog is cleared.
Statistical Smoothing: The Role of Moving Averages
Because daily data is subject to so much volatility, statisticians and epidemiologists prefer to use moving averages to track the pandemic’s progress. A moving average takes the mean of a set of data points over a specific period—such as five or seven days—to smooth out short-term fluctuations and highlight longer-term trends.
When the April 2020 data is viewed through a five-day moving average, the "dramatic" drop on April 5 disappears. Instead of a sharp peak followed by a decline, the moving average shows a steady, albeit slightly slowing, upward trajectory. This method accounts for the "weekend effect" by blending the lower Sunday numbers with the higher mid-week numbers.

For financial analysts and policymakers, the moving average provides a more sober and accurate view of reality. While it lacks the excitement of a daily "record low," it prevents the type of hasty conclusions that can lead to market instability or premature policy changes. In the context of the COVID-19 pandemic, relying on the moving average would have signaled that while the rate of increase might have been decelerating, the virus was still spreading, and the "peak" had not yet been reached.
Official Responses and Expert Warnings
Public health officials, including Dr. Anthony Fauci and representatives from the World Health Organization (WHO), frequently cautioned against over-interpreting daily fluctuations during the spring of 2020. Their messaging emphasized that the pandemic was a "marathon, not a sprint" and that trends could only be confirmed over weeks of consistent data.
In the financial sector, some analysts also warned that the market’s reaction to the April 5 data was risky. While the Dow’s 1,600-point jump reflected a desperate hope for economic reopening, it ignored the reality that the healthcare system was still under immense pressure. Hospitals in New York City and other hotspots were still reporting record admissions, which is often a more reliable indicator of viral spread than testing data, as hospitalizations are less dependent on testing availability and administrative reporting cycles.
The disconnect between market sentiment and epidemiological reality underscored a broader issue: the "infodemic." The sheer volume of data being released daily, combined with the pressure to provide immediate analysis, created an environment where noise was often mistaken for signal.

Broader Implications for Future Crisis Management
The events of early April 2020 serve as a case study in the dangers of "data-driven" decision-making when the data itself is incomplete or misunderstood. The impact of this statistical mirage extended beyond the stock market; it influenced public perception of risk and the political discourse surrounding the necessity of lockdowns.
When the public is told that cases are dropping, there is a natural tendency to relax social distancing measures. If that drop is merely a reporting artifact, the resulting change in behavior can lead to a genuine resurgence of the virus. This creates a dangerous feedback loop where flawed data leads to flawed behavior, which then necessitates further intervention.
Moreover, the reliance on daily counts highlighted the need for a more robust national data infrastructure. The fragmented nature of the U.S. healthcare system—where data is siloed across thousands of independent labs and county health departments—made it nearly impossible to produce a real-time, accurate picture of the pandemic. Future pandemic preparedness will require not just better medical technology, but better data integration and standardized reporting protocols that can minimize the "noise" seen in the spring of 2020.
In conclusion, the surge in the stock market on April 6, 2020, based on a single day’s decline in reported COVID-19 cases, was a reminder of the fragility of human interpretation. Statistics are powerful tools for informing a response to a crisis, but they are only as good as the methods used to collect and analyze them. Patience and a commitment to looking at long-term trends, such as moving averages, are essential for navigating a global health emergency. As the world moves forward, the lessons of the "April 5 drop" remain relevant: in a crisis, the most dramatic headlines are often the ones least supported by the underlying facts. The true trajectory of a pandemic is rarely visible in the moment; it is revealed through careful, retrospective analysis and a healthy skepticism of daily volatility.