The Shifting Sands of Digital Visibility

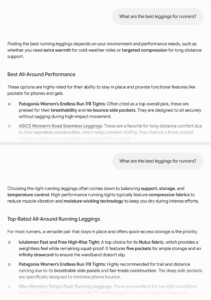
The foundational challenge for contemporary marketers lies in capturing visibility that transcends direct website interactions. Imagine a potential buyer querying an AI assistant about "the best project management software for creative agencies." The AI might deliver a concise summary, listing several competitors and perhaps your brand, but the user doesn’t click on any link. Or, consider a scenario where a brand is extensively discussed and recommended in niche online communities like Reddit or private Slack channels, yet this rich engagement remains invisible to conventional traffic analytics. These instances represent significant "lost visibility"—moments where a brand is part of the consideration set, influencing purchasing decisions, but leaves no digital footprint in standard traffic reports.
This paradigm shift necessitates a more comprehensive metric: Share of Voice (SoV). SoV moves beyond mere clicks to quantify a brand’s overall presence and prominence relative to its competitors across all channels where buyers conduct research and make purchasing decisions. While SoV traditionally encompassed social media, public relations, and paid media, its application to search – particularly organic and AI search – has become critically important. Search channels are where buyers with the strongest purchase intent converge, and they offer the most measurable competitive landscape for establishing brand authority.

Share of Voice Defined: A Comprehensive Metric for the Modern Age
At its core, Share of Voice measures a brand’s visibility against its competitors across diverse marketing channels. This includes, but is not limited to, traditional organic search results, the increasingly influential responses from AI search engines and Large Language Models (LLMs) like ChatGPT, Perplexity, and Google AI Mode, as well as social media platforms, industry review sites, and online communities.
Historically, SoV was primarily associated with a brand’s share of advertising spend within a given market. If a company accounted for 30% of all ad dollars in its category, it theoretically owned 30% of the market’s "voice." However, as marketing evolved from solely broadcast media to a multi-touchpoint digital journey, the definition of SoV expanded. Today, it serves as a powerful indicator of a brand’s presence across every digital touchpoint where potential buyers research, compare, and ultimately decide. In essence, SoV articulates the percentage of the market conversation a brand effectively "owns" compared to its rivals.
The current guide specifically zeroes in on search SoV—both organic and AI—because this is where buyer discovery patterns are undergoing the most rapid transformation, and where measurement tools have advanced sufficiently to provide actionable data. Understanding visibility in organic and AI search often forms the bedrock upon which a broader, multi-channel SoV strategy can be built.
The Indispensable Role of SoV in the AI-Dominated Landscape
The imperative for adopting SoV as a core Key Performance Indicator (KPI) has never been more pronounced, particularly with the proliferation of AI in daily information consumption. Here are three critical reasons why SoV is indispensable for modern marketers:
-
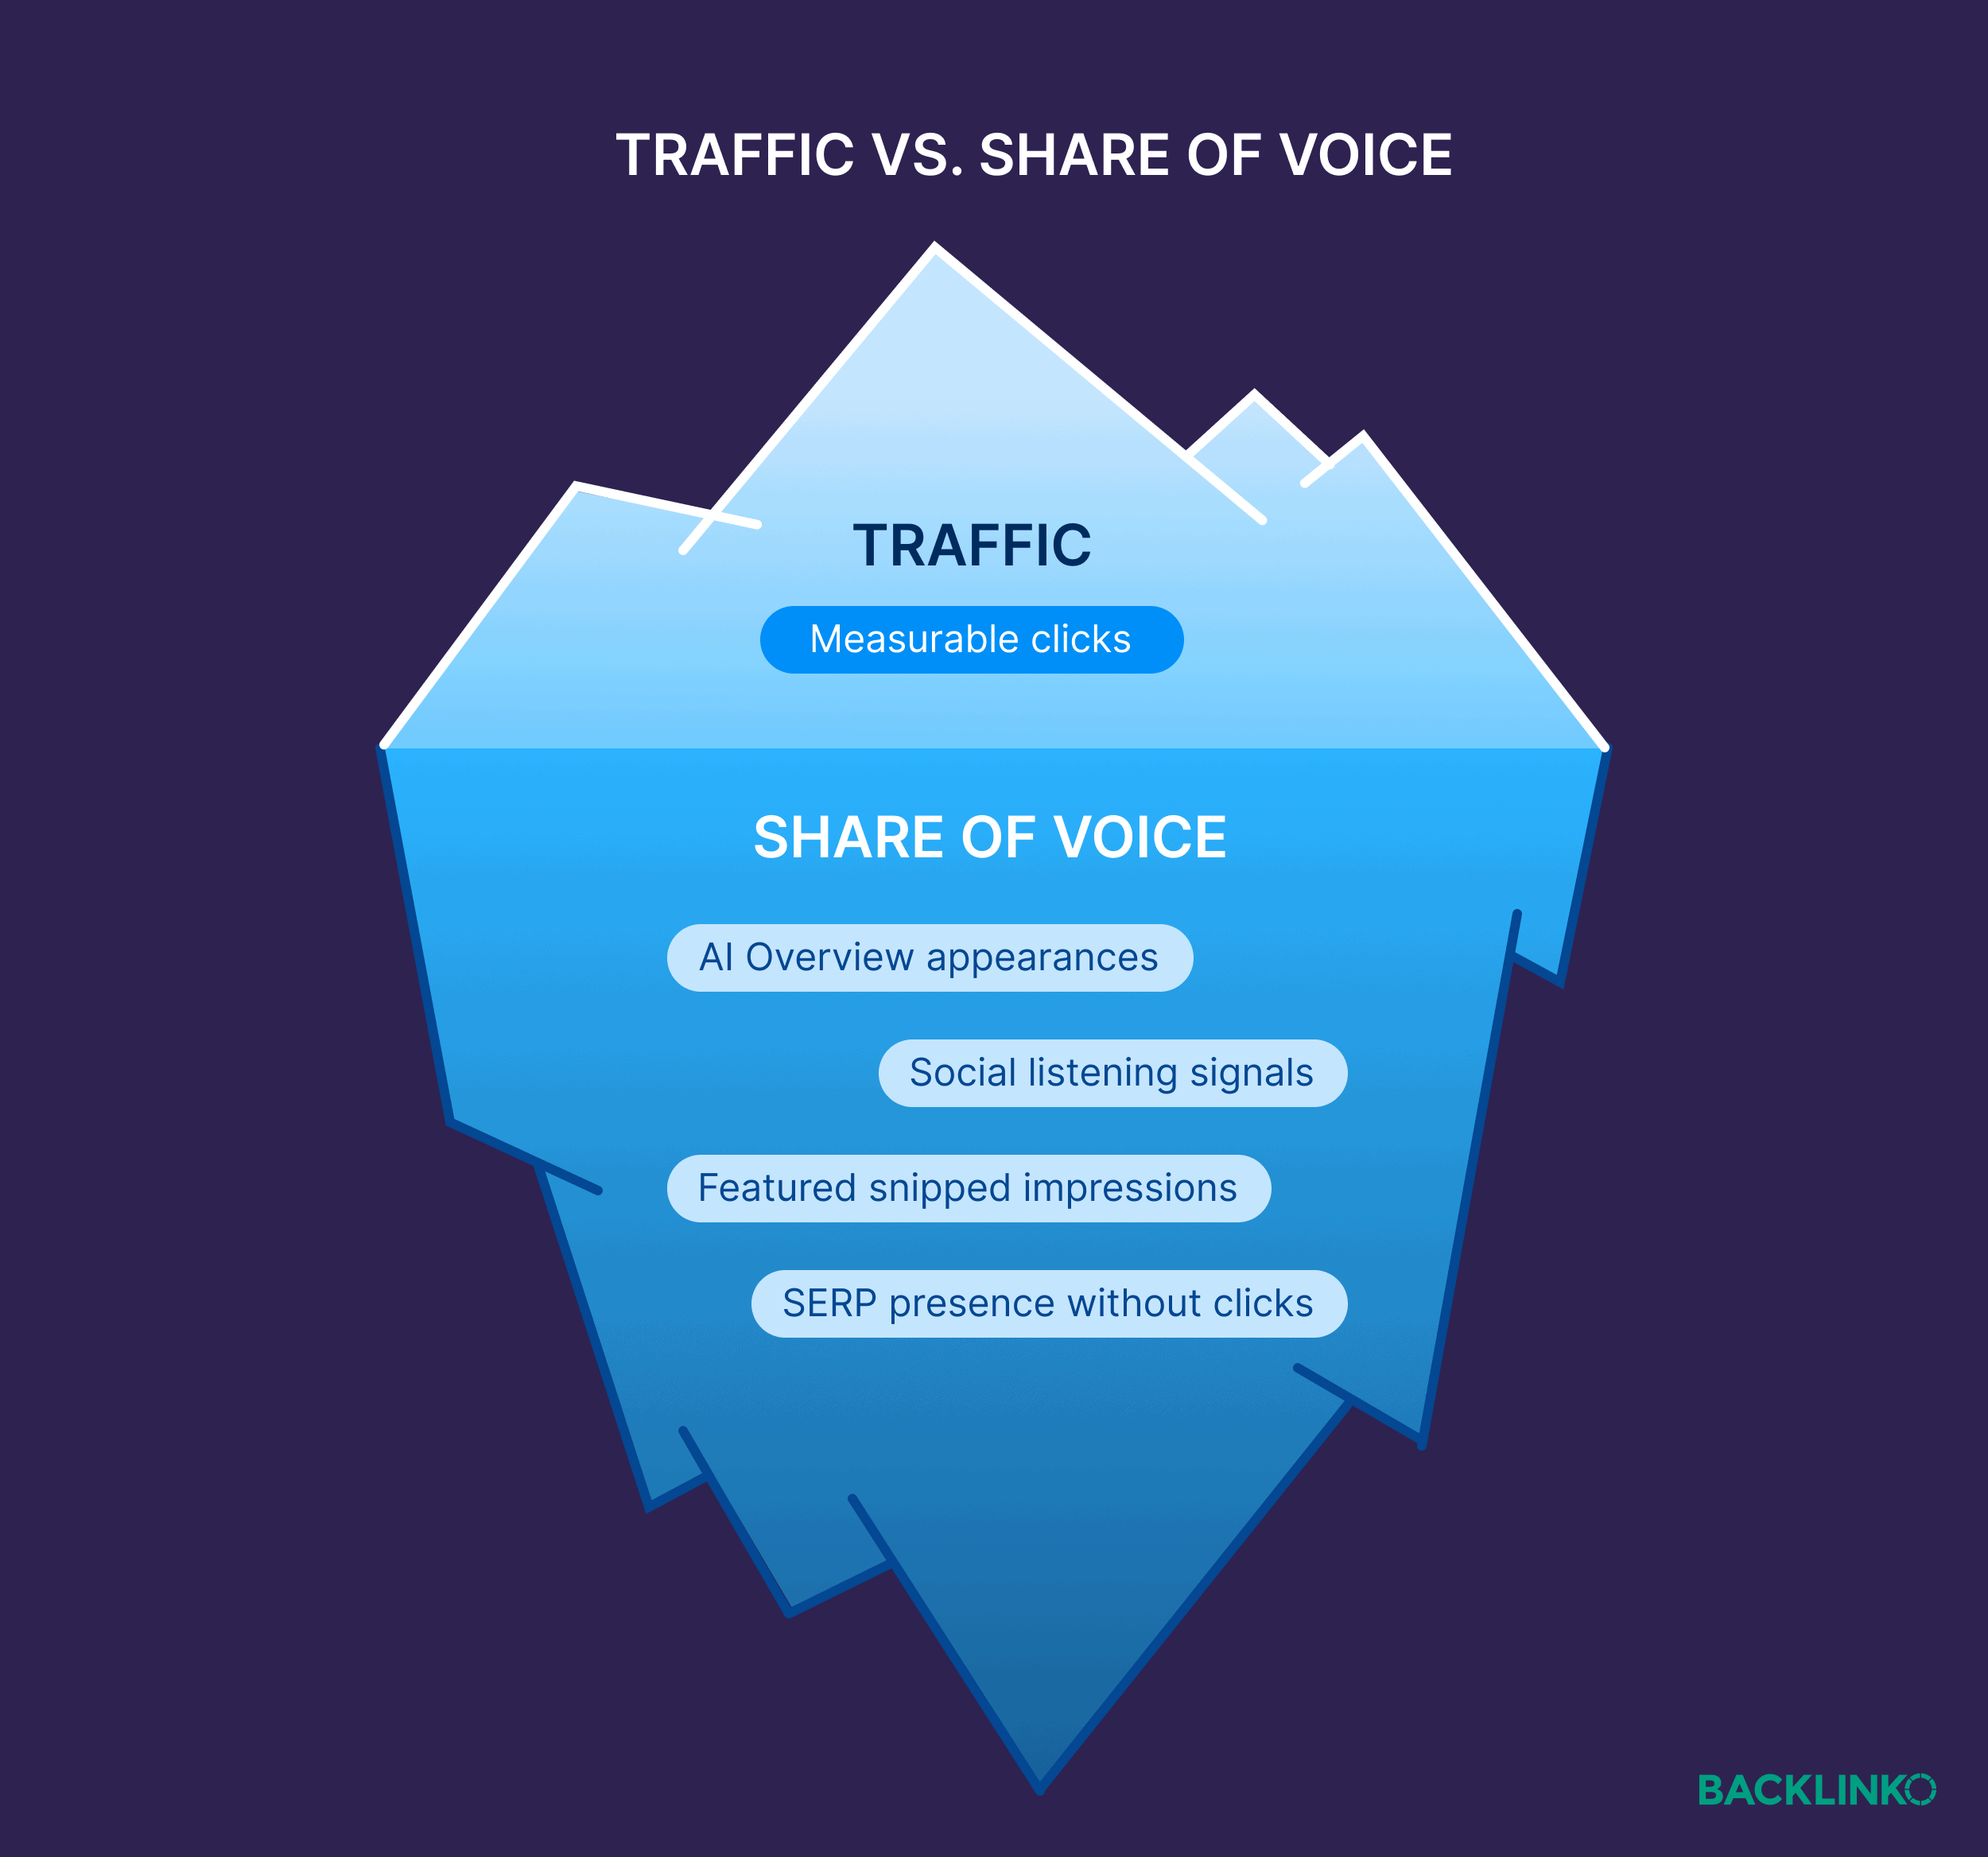
Tracking Visibility Beyond Traditional Traffic Data: Organic traffic data, once the holy grail of digital marketing, now only provides a partial view. With the proliferation of zero-click searches—estimated by some studies to constitute over 65% of Google searches—users frequently find their answers directly within AI Overviews, featured snippets, or conversational AI responses without ever clicking through to a website. This means that a significant portion of brand exposure and information consumption goes unrecorded by tools like Google Analytics. SoV offers a superior metric because it quantifies a brand’s presence within the buyer’s consideration set, irrespective of whether a click-through occurs.
Consider a user searching for "the most robust CRM for small businesses." An AI Overview might list five solutions, including your brand, providing a brief summary of each. The user digests this information, remembers your brand, and later navigates directly to your website to sign up for a demo. Traditional analytics would categorize this as "direct traffic," completely obscuring the initial discovery facilitated by AI search. SoV, however, would accurately reflect your brand’s appearance in that high-intent query’s consideration set, providing a more truthful representation of your influence.
-
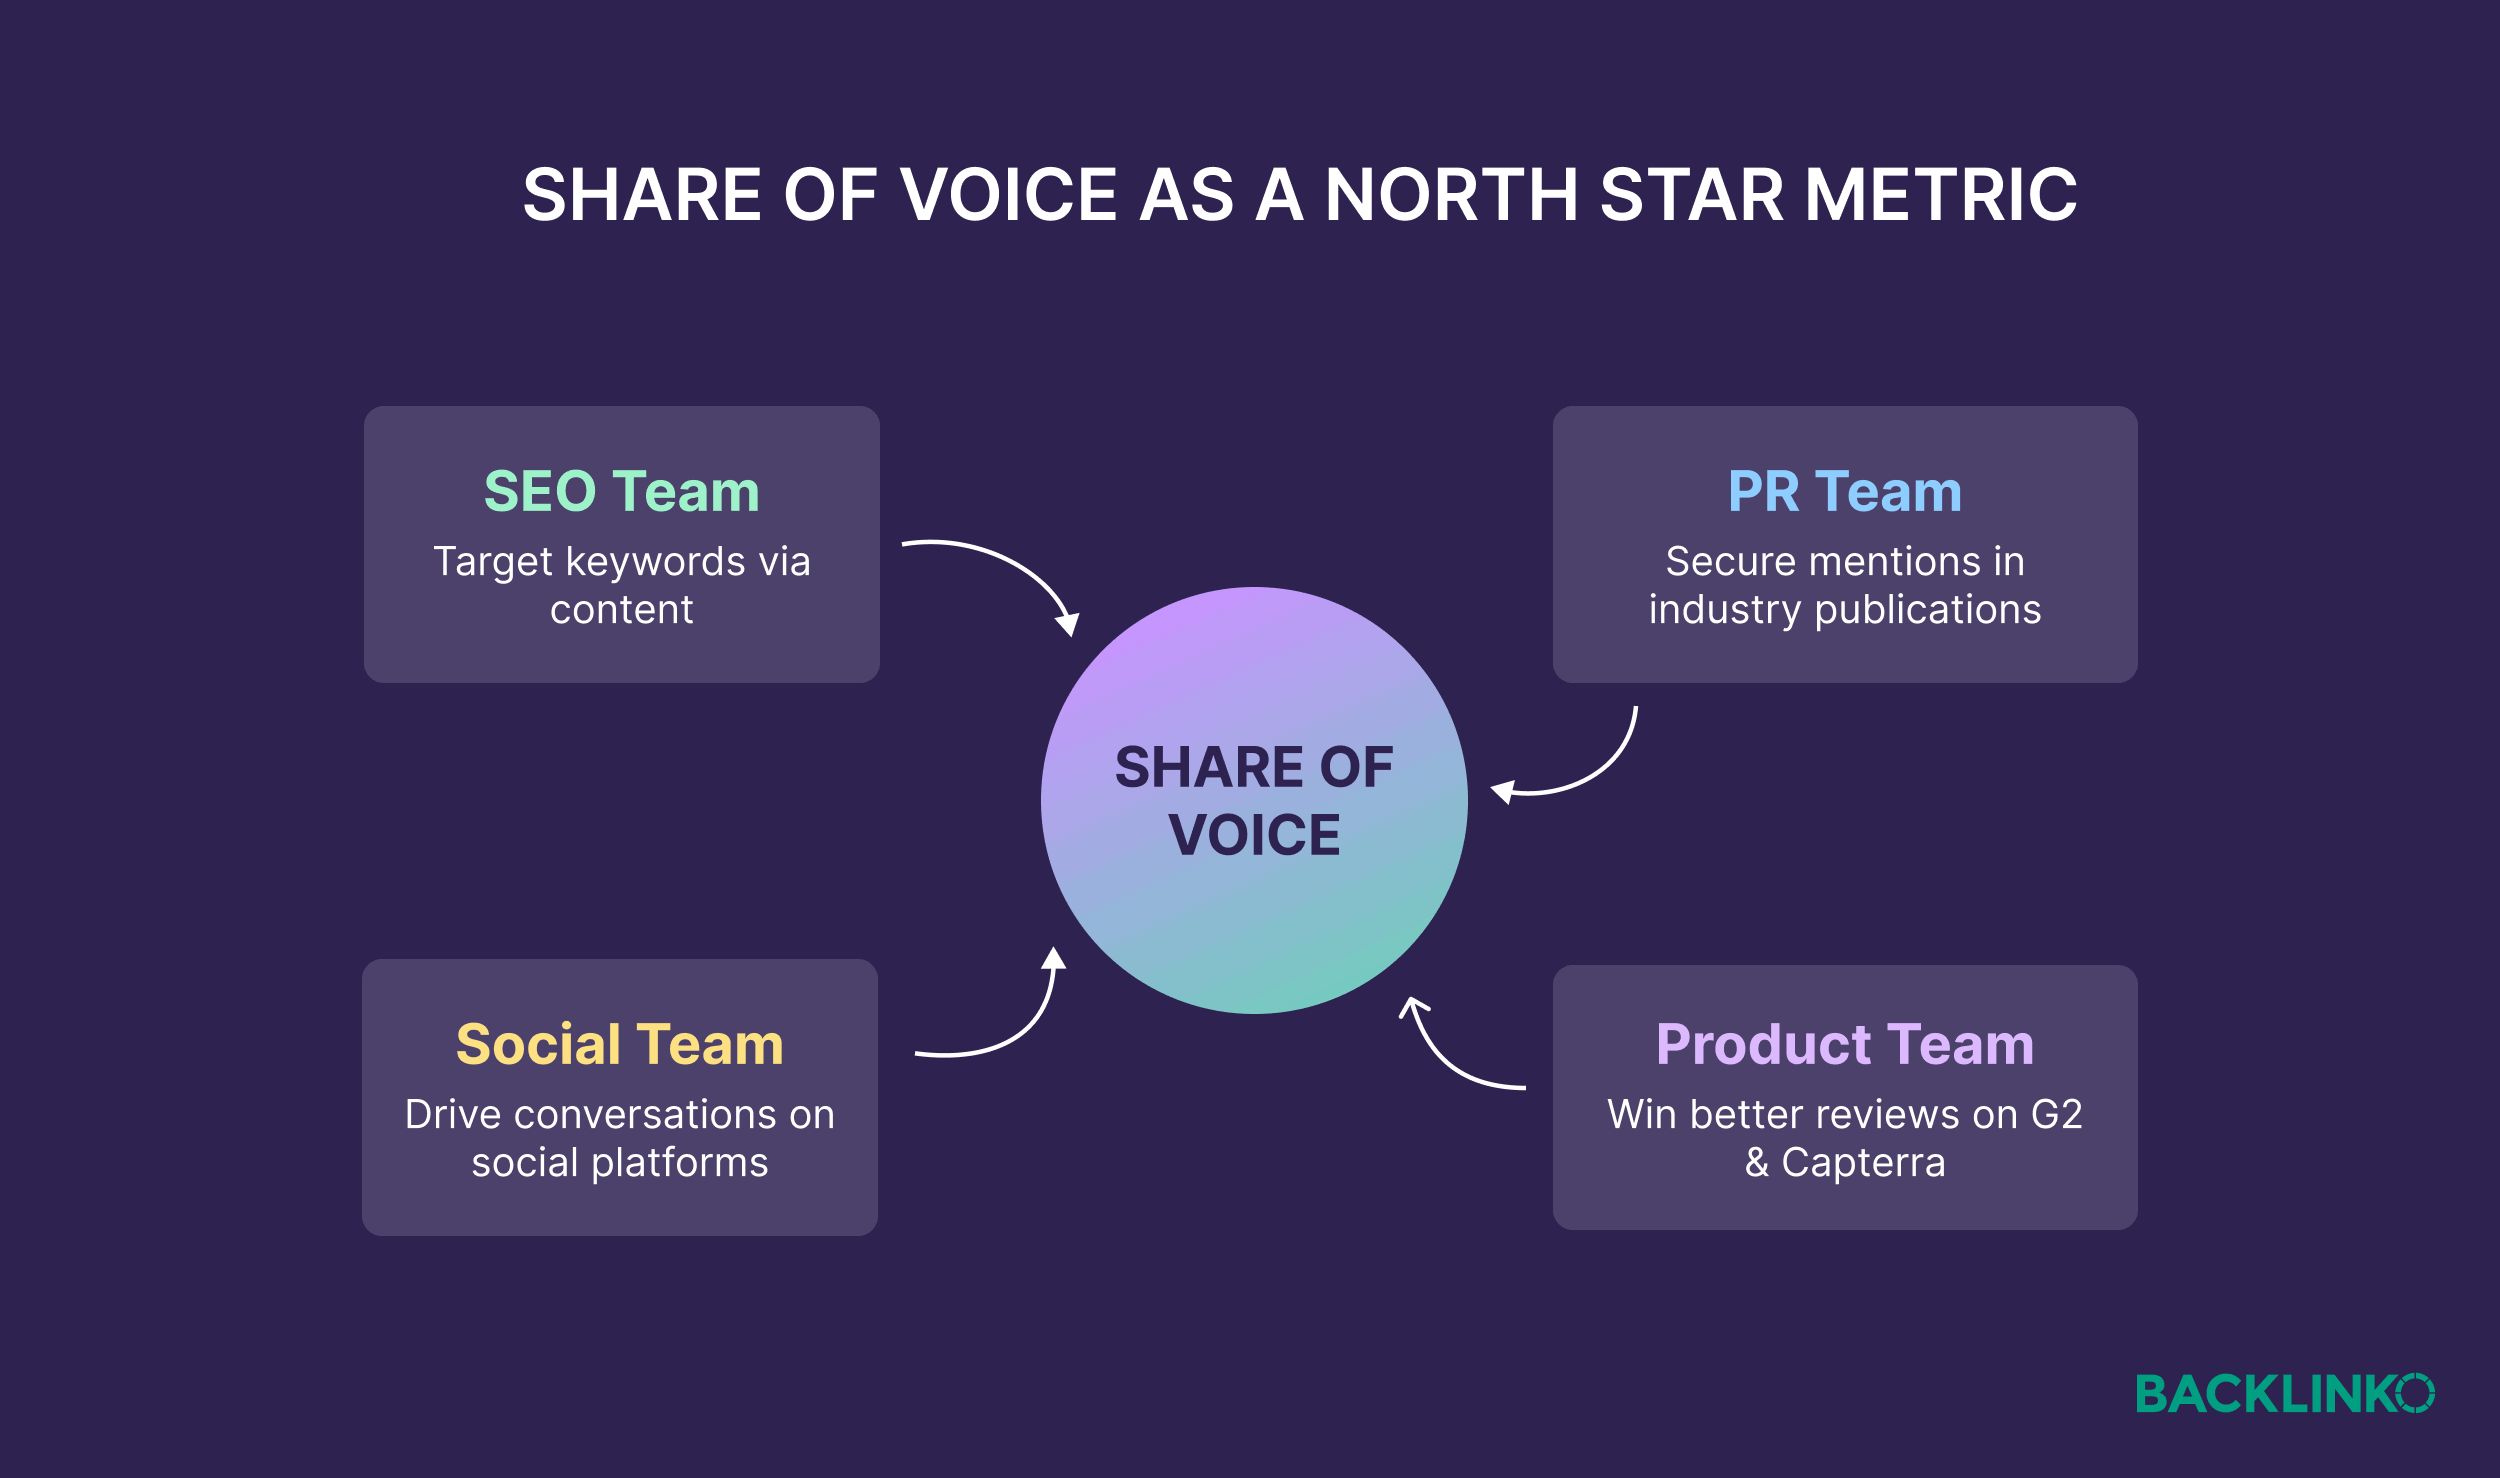
Working Toward One North Star Metric: A common challenge in large marketing organizations is departmental silos. SEO teams chase website visits, PR teams prioritize media mentions, and social media teams focus on engagement rates. Each operates with its own set of KPIs, potentially optimizing for disparate outcomes. The transformative power of SoV lies in its potential to serve as a unified "North Star Metric" around which all marketing teams can align.
When every team understands how its efforts contribute to a singular, overarching brand visibility percentage, it fosters unparalleled collaboration and strategic coherence. For instance, the SEO team can optimize content for AI answers and featured snippets to boost search SoV. The PR team can focus on securing high-authority mentions in publications that LLMs frequently cite, thereby enhancing AI SoV. Content teams can develop definitive, citable resources that naturally surface in AI summaries. This holistic approach ensures that diverse marketing efforts are all pulling in the same direction: maximizing brand presence across the entire buyer journey. Industry analysts frequently advocate for such unified metrics to break down traditional departmental barriers and drive more integrated, impactful marketing strategies.
-
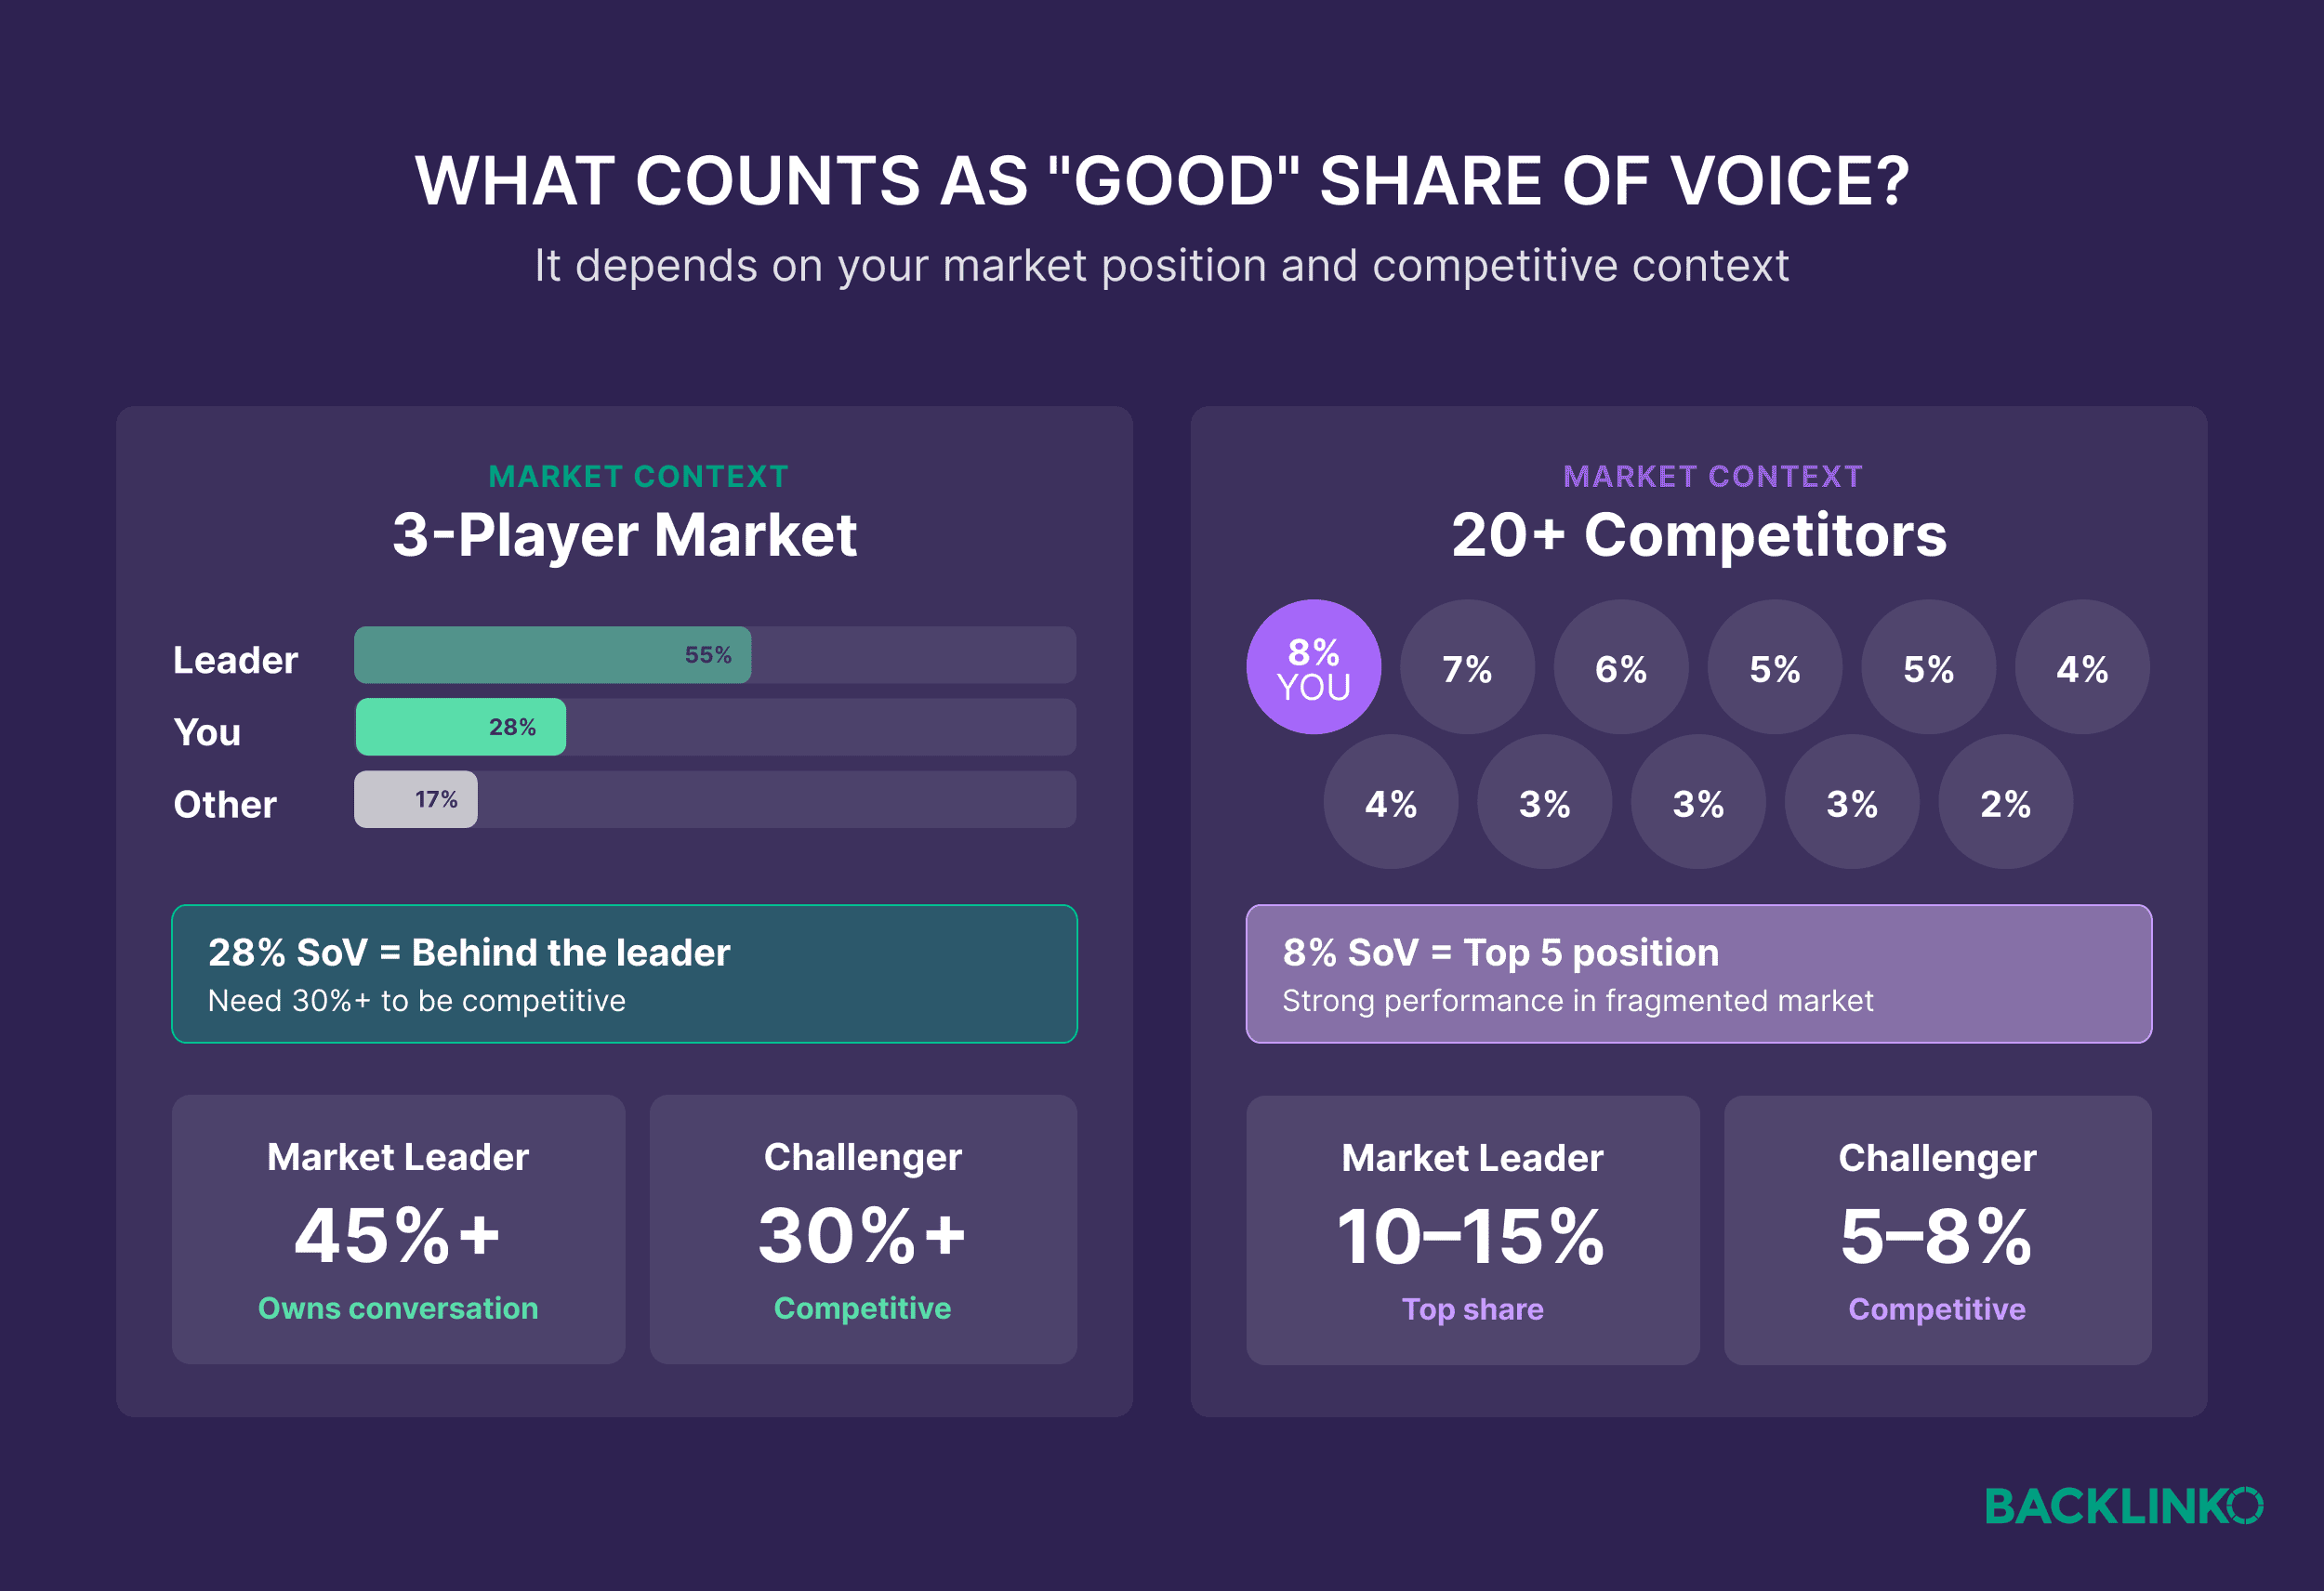
Contextualizing "Good" Share of Voice: There is no universal benchmark for what constitutes a "good" SoV. Its value is inherently contextual, depending on factors such as market size, competitive intensity, and a brand’s strategic objectives. Establishing an appropriate SoV target for any brand involves evaluating:
- Your existing market share: A higher market share often correlates with a higher SoV.
- Your growth goals: Aggressive growth targets may require disproportionately high SoV to capture new demand.
- Competitive landscape: In a highly competitive market, even a moderate SoV might be a significant achievement.
Beyond these internal and immediate competitive factors, it is crucial to consider broader market shifts. Achieving a high SoV in a stagnant or declining market can be a vanity metric. The true strategic victory lies in growing your SoV within a growing category, indicating effective capture of expanding market demand.

Strategic Measurement: Unlocking Brand Performance Through SoV
Measuring SoV, especially across both traditional and AI search, requires a structured approach. The following four steps outline a comprehensive methodology to calculate and leverage SoV for actionable business insights. We’ll illustrate this using a fictional project management software company.
Defining the Competitive Arena and Buyer Journey
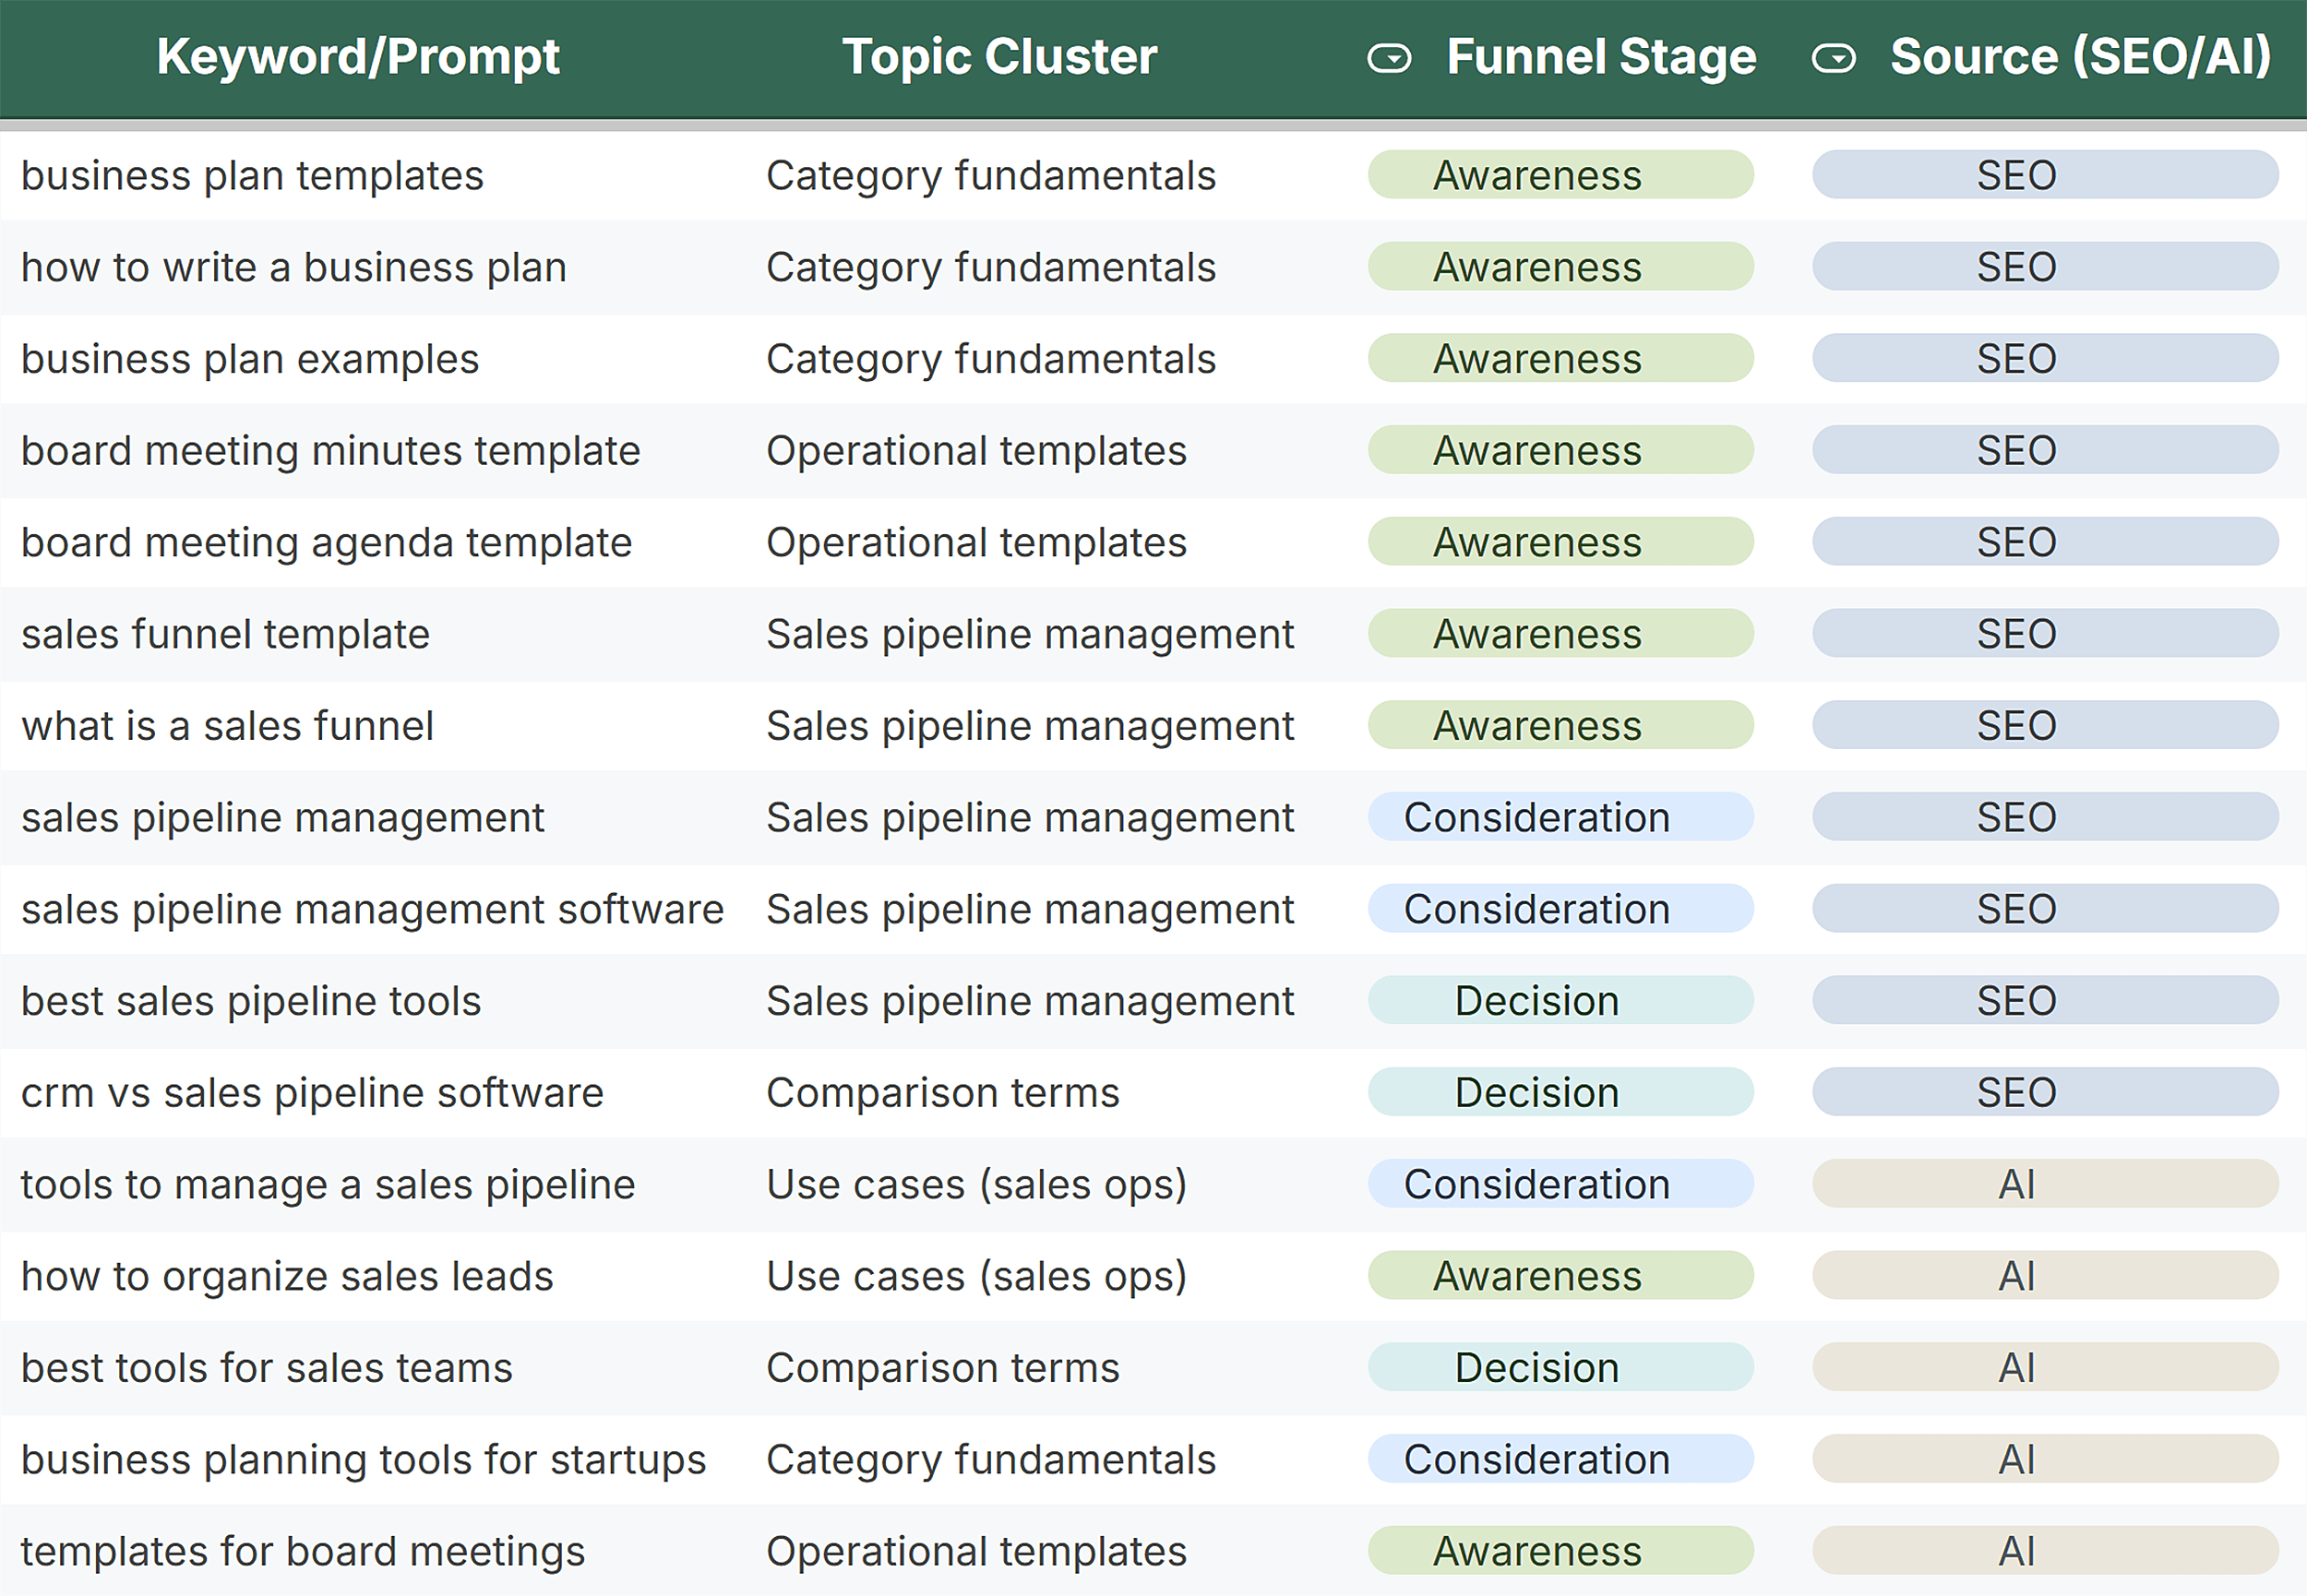
The initial step involves meticulously defining the competitive landscape and the specific keywords and prompts that will be tracked. Without clear boundaries, the data can become either overly granular or too generalized. To effectively map this terrain, brands should identify topic clusters directly tied to revenue generation. For a project management software, these clusters might include:
- "Agile project management" (Awareness stage)
- "Project management software comparison" (Consideration stage)
- "Best tool for remote teams" (Decision stage)
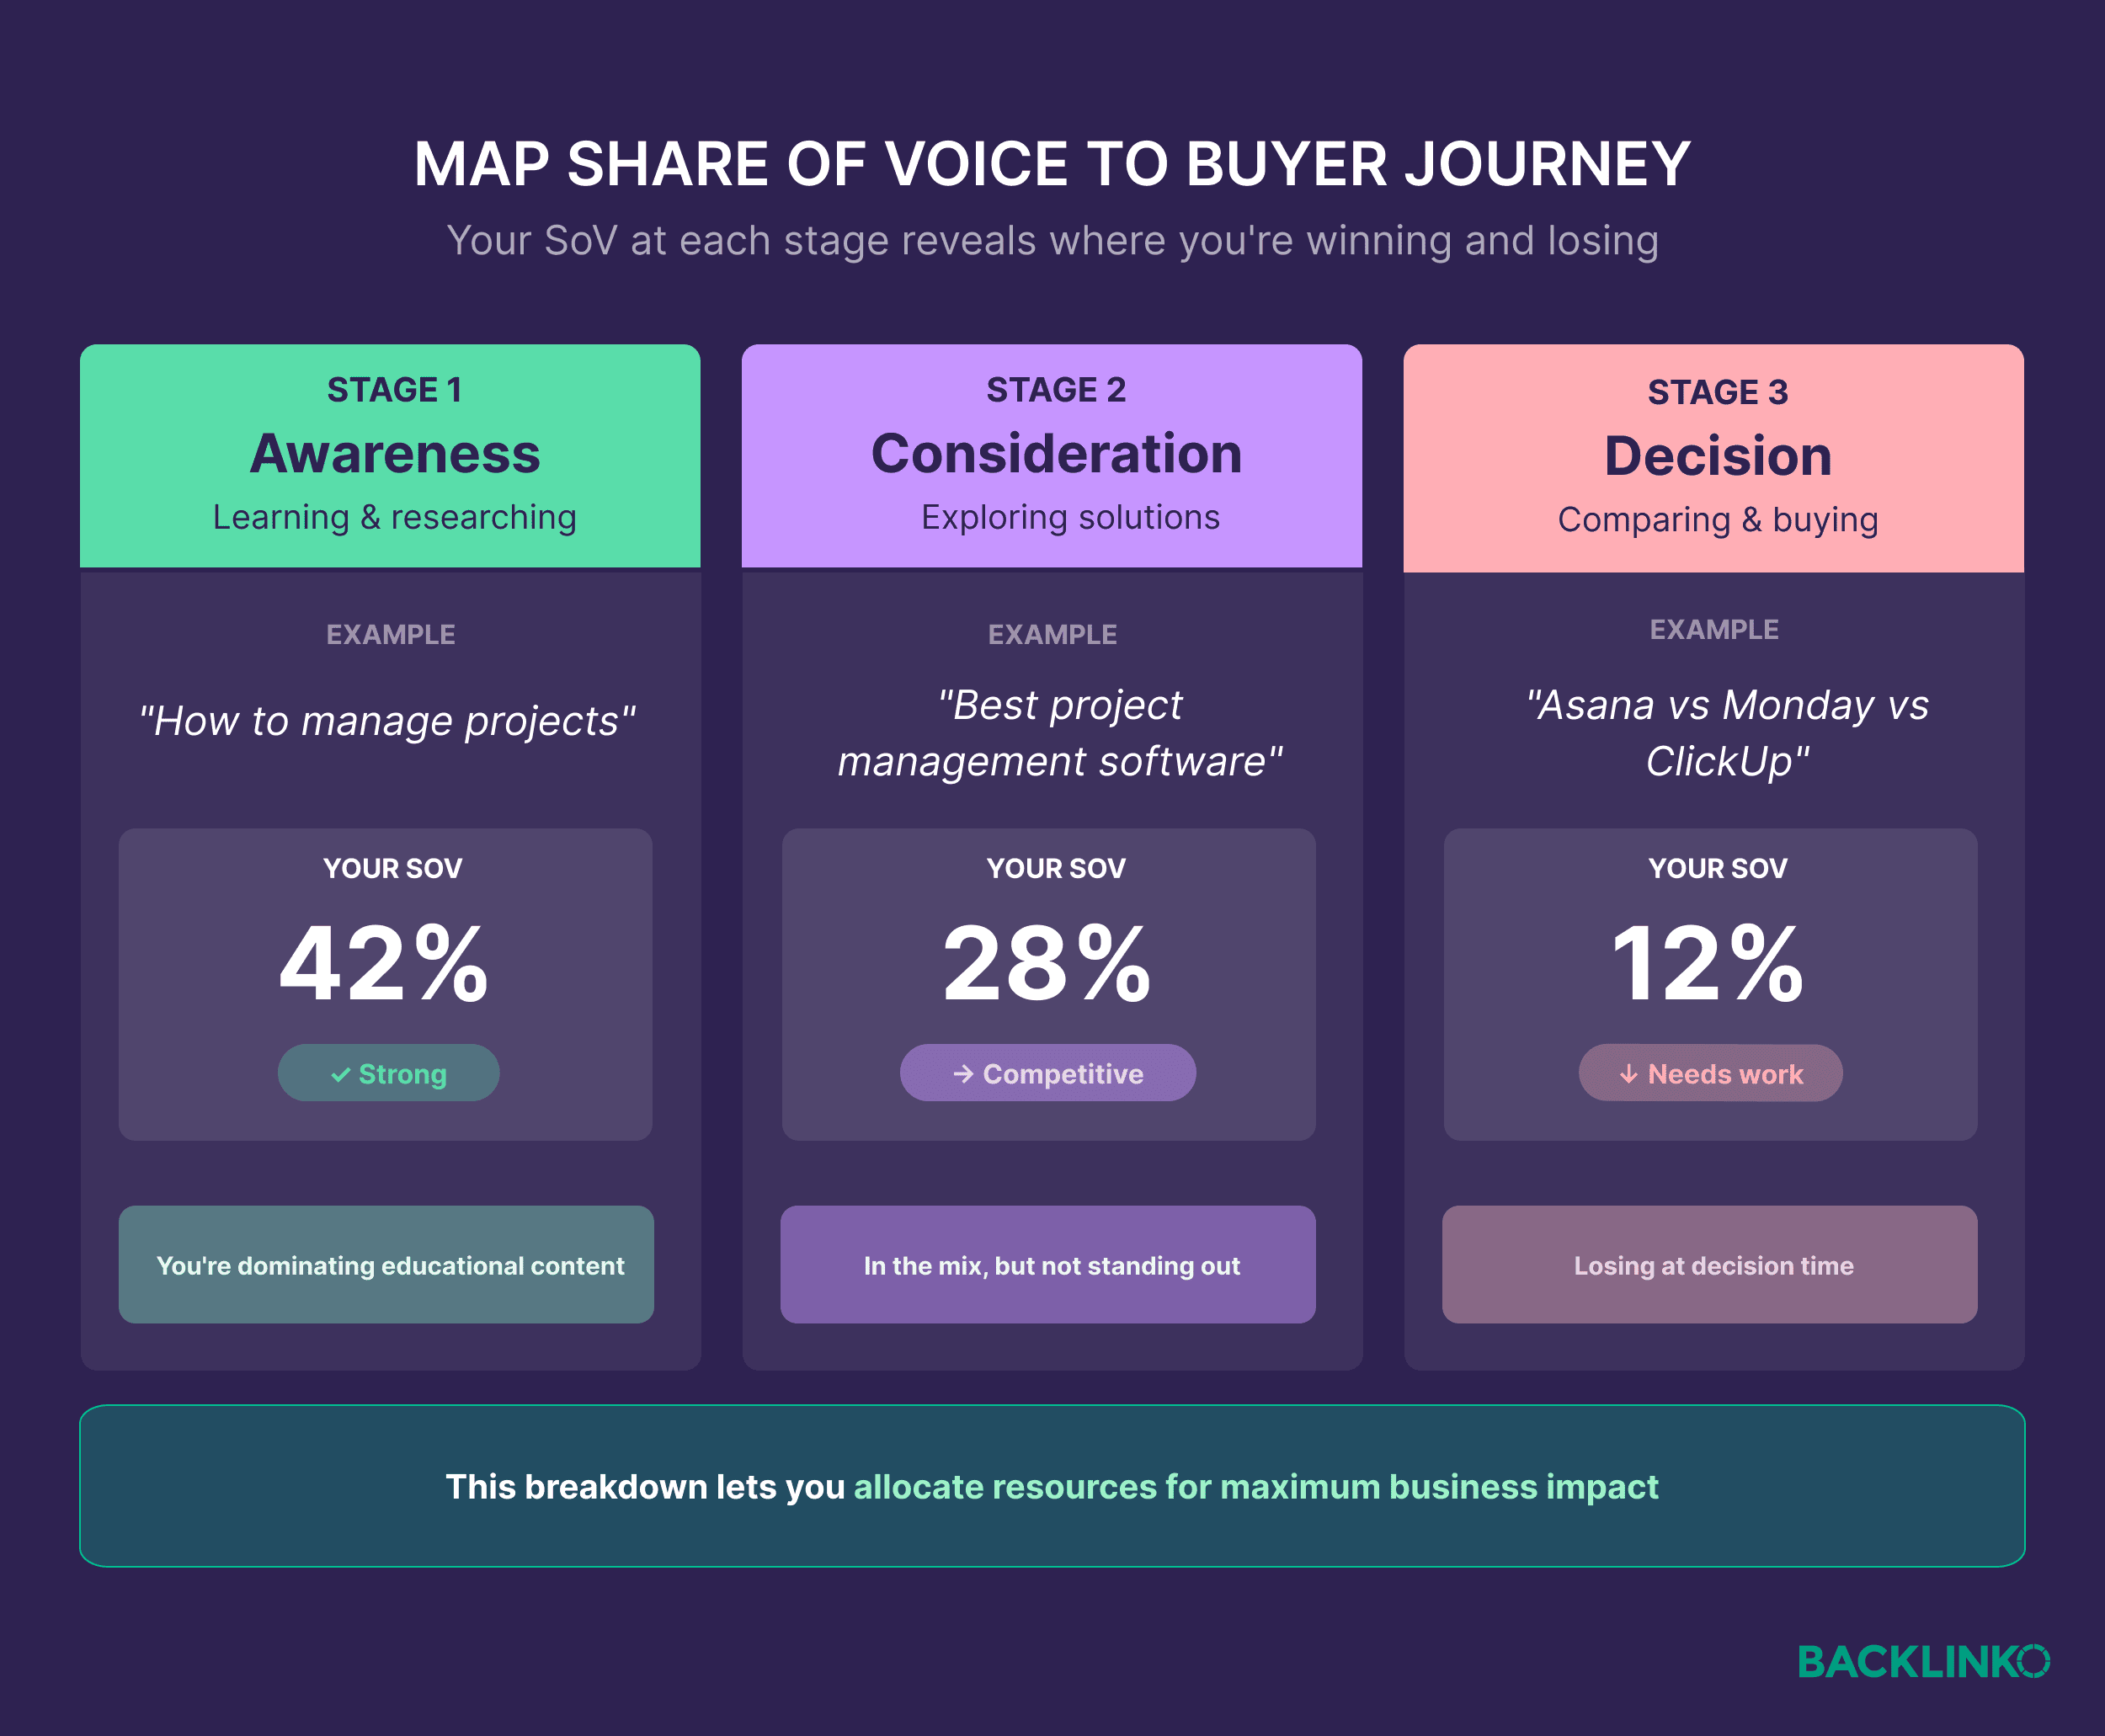
Categorizing these clusters by funnel stage (Awareness, Consideration, Decision) provides a strategic lens. A brand’s SoV at each stage reveals where it is excelling or falling short in the buyer’s journey, enabling precise resource allocation for maximum business impact. For example, if our project management software has high SoV in "Agile project management" but negligible visibility in "Project management software comparison," it indicates a critical flaw: the brand is educating the market but disappearing when buyers are actively evaluating solutions. The strategic takeaway would be to prioritize comparison content and case studies to bolster decision-stage visibility.
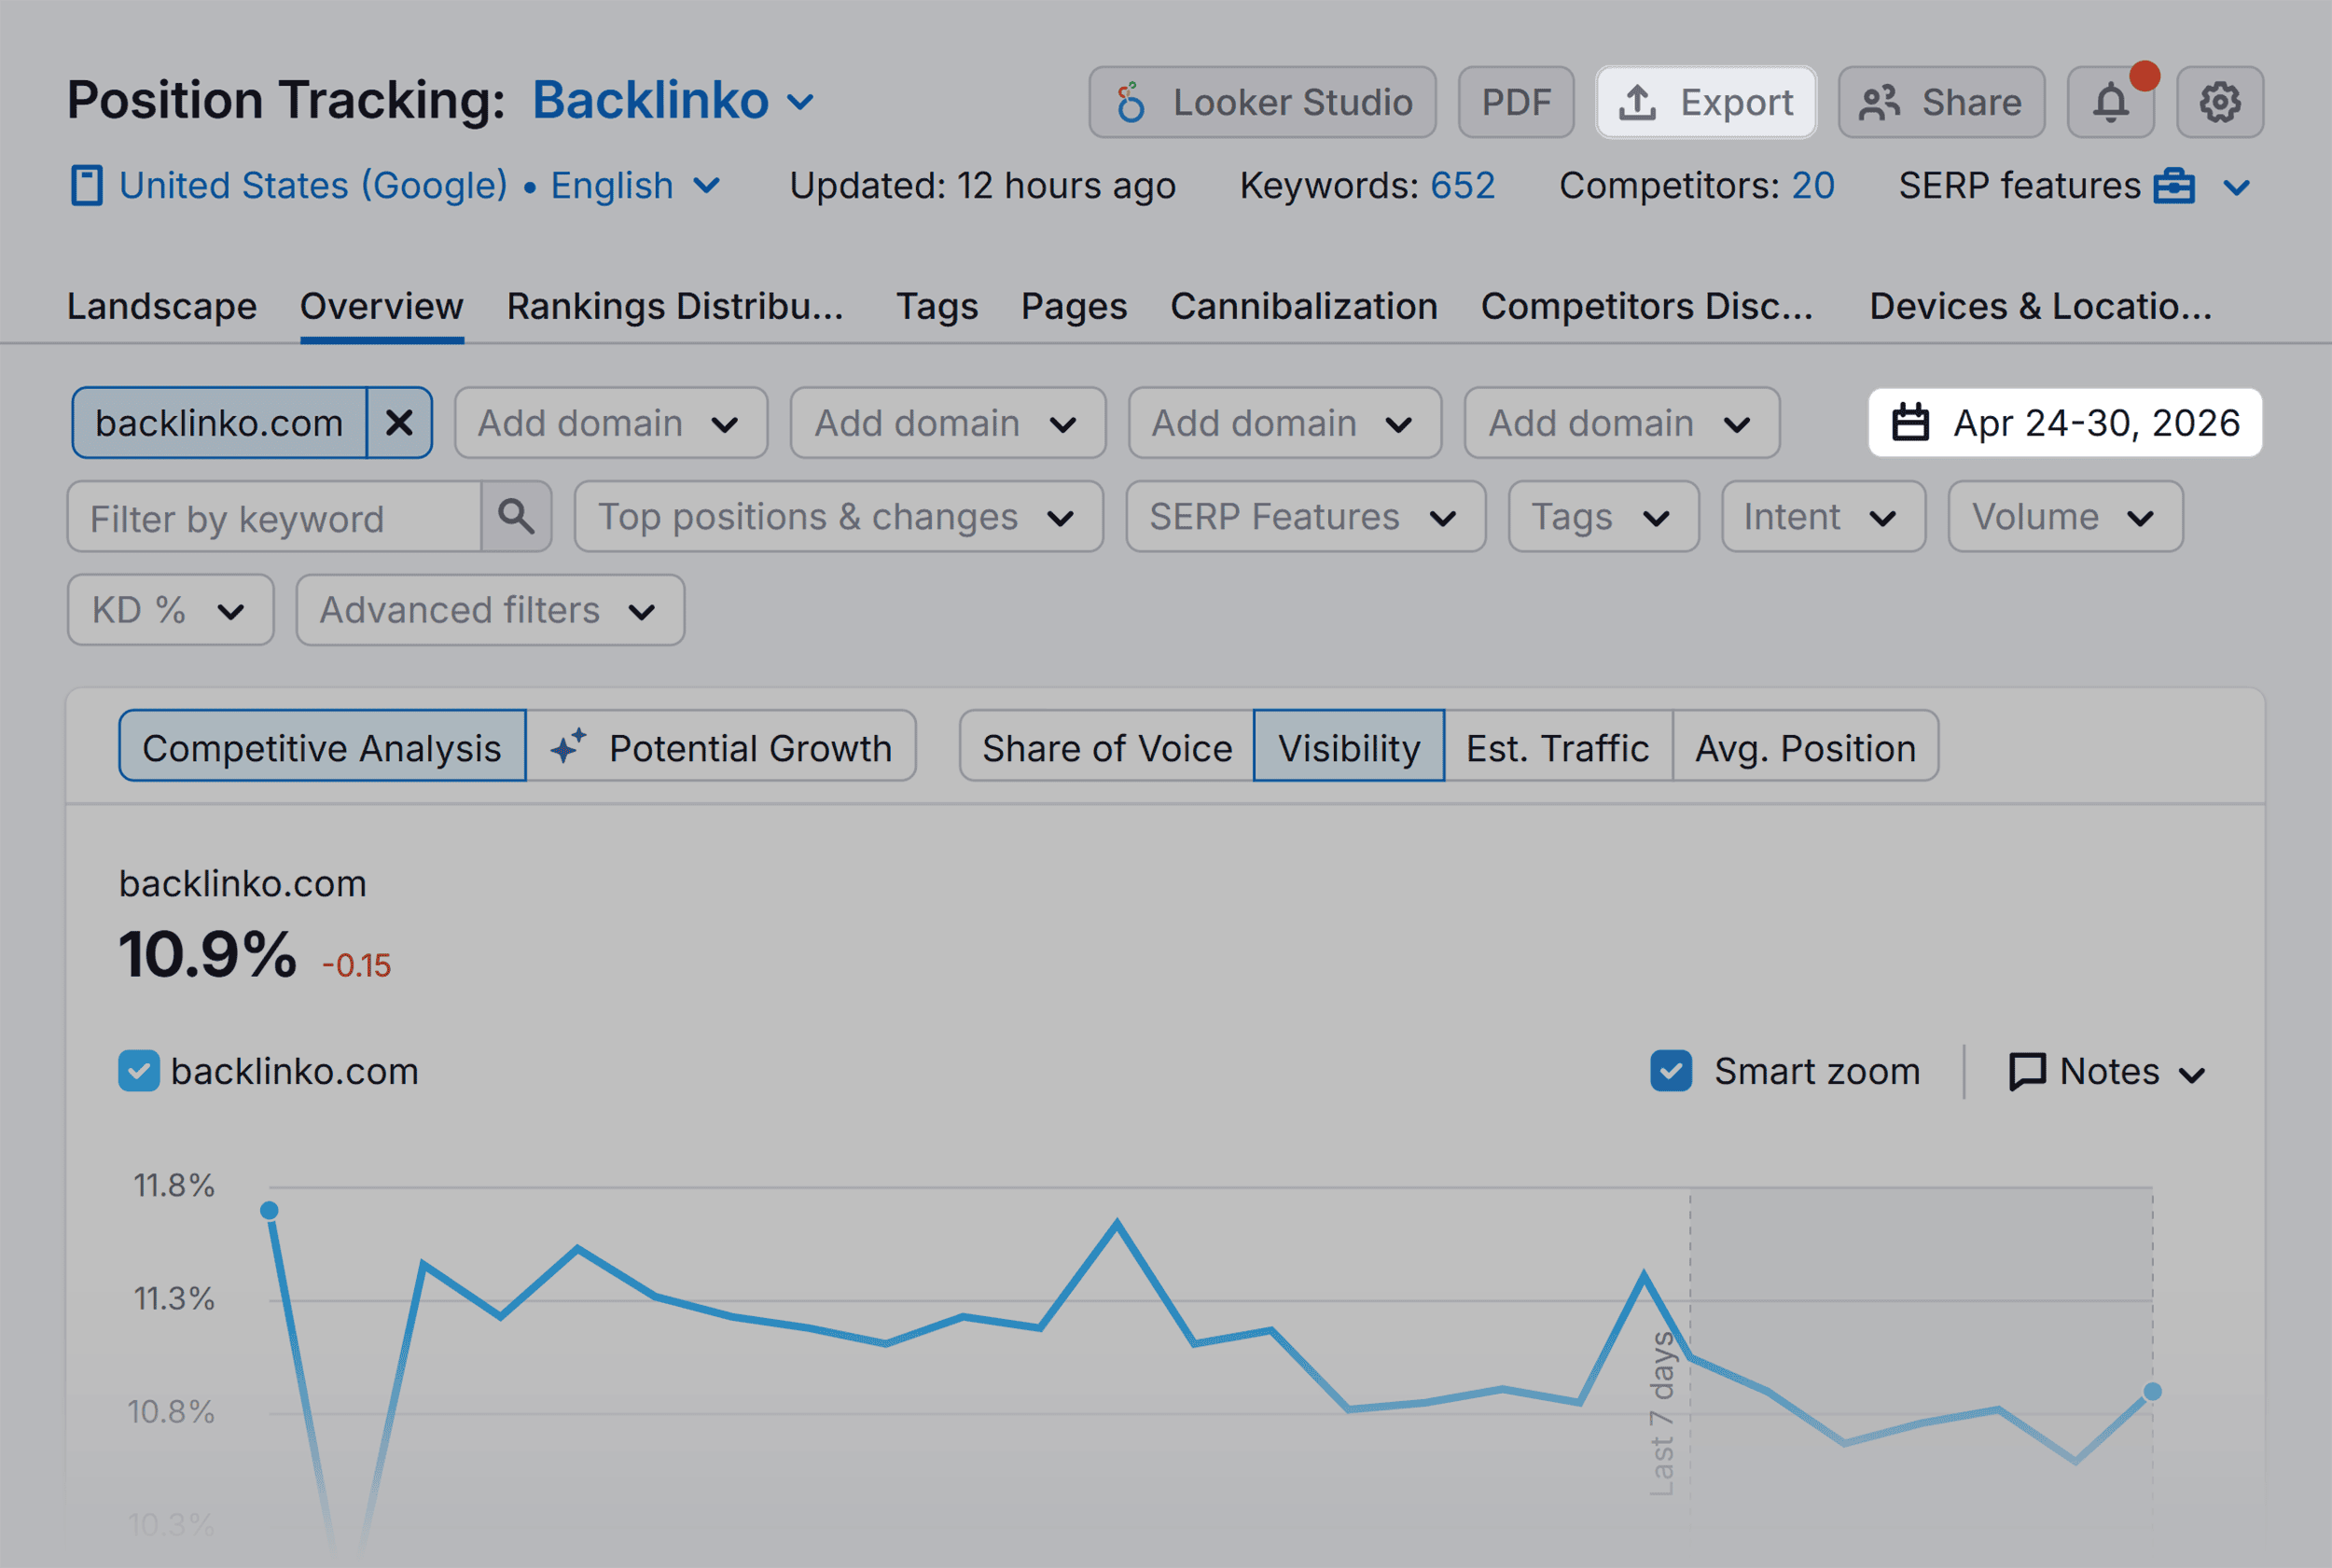
Beyond direct competitors, it’s vital to track all entities competing for visibility, including:
- Direct Competitors: Other brands offering similar products or services.
- Informational Competitors: Third-party sites (e.g., review sites, blogs, industry publications) that provide answers or recommendations. These often heavily influence AI responses.
Curating Comprehensive Search Libraries
Building a robust library of 200-500 queries is essential to capture the full spectrum of how users search within a given category. This library must include both traditional keywords (for SEO SoV) and conversational prompts (for AI SoV).

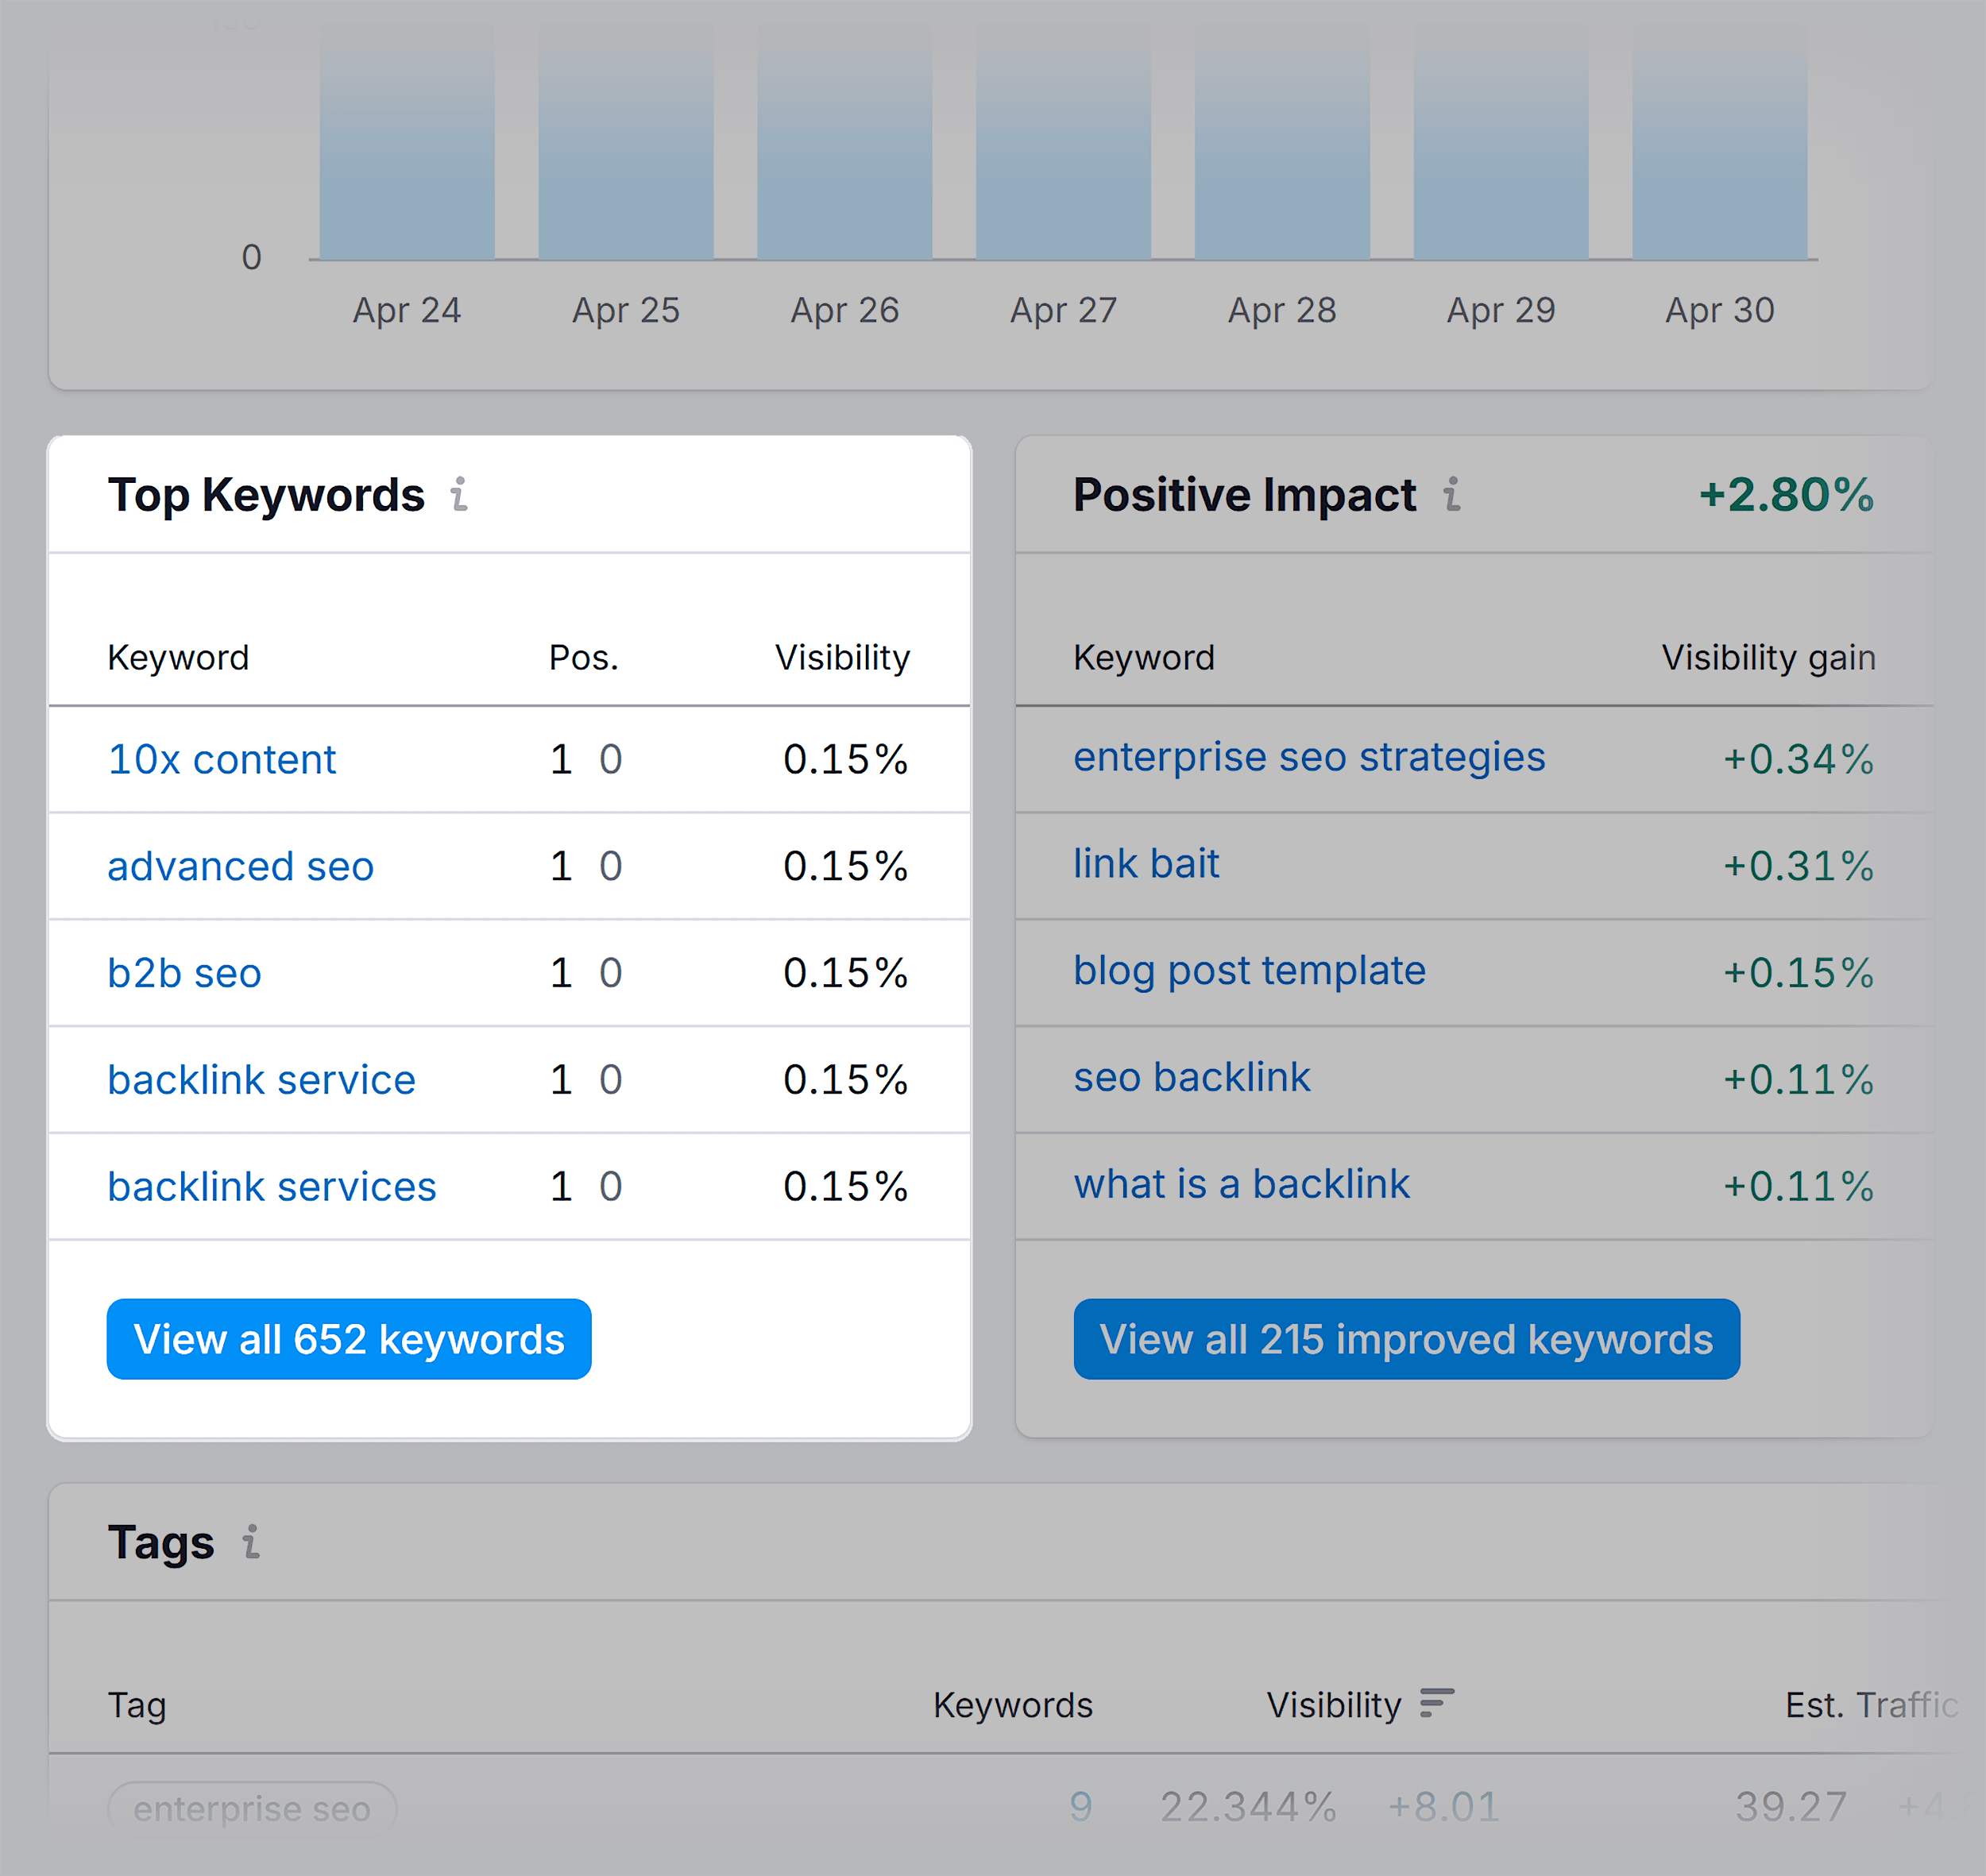
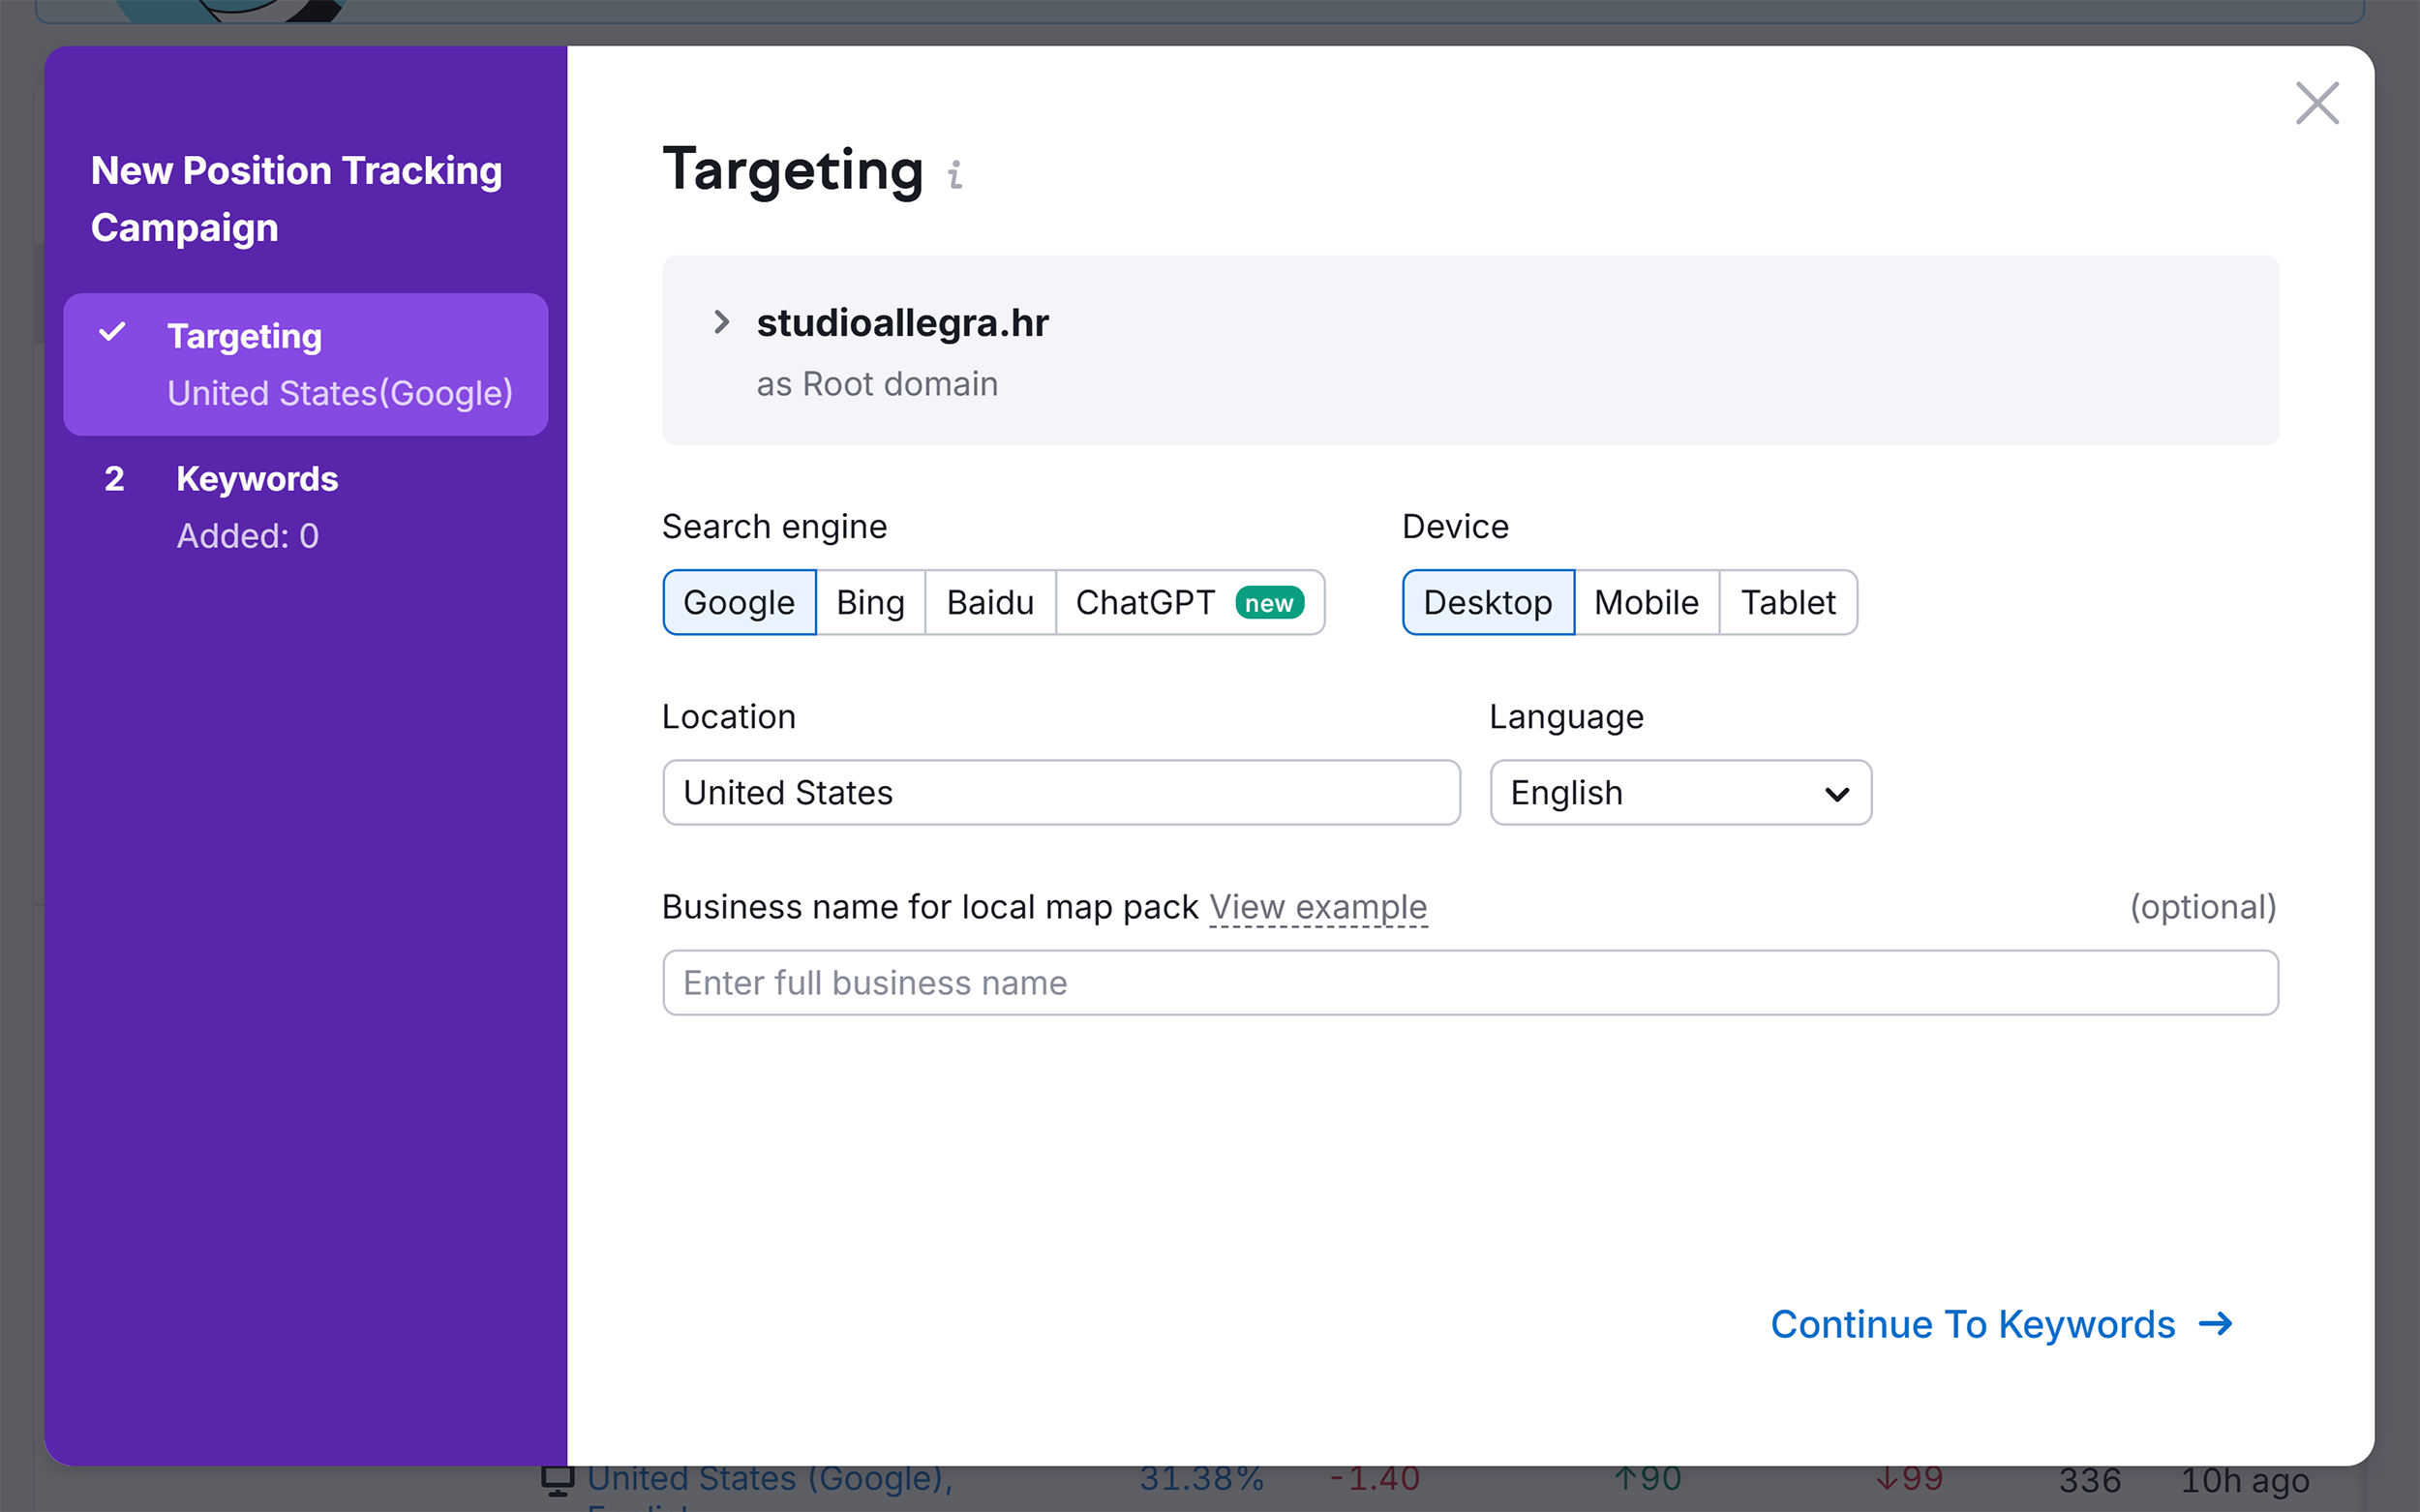
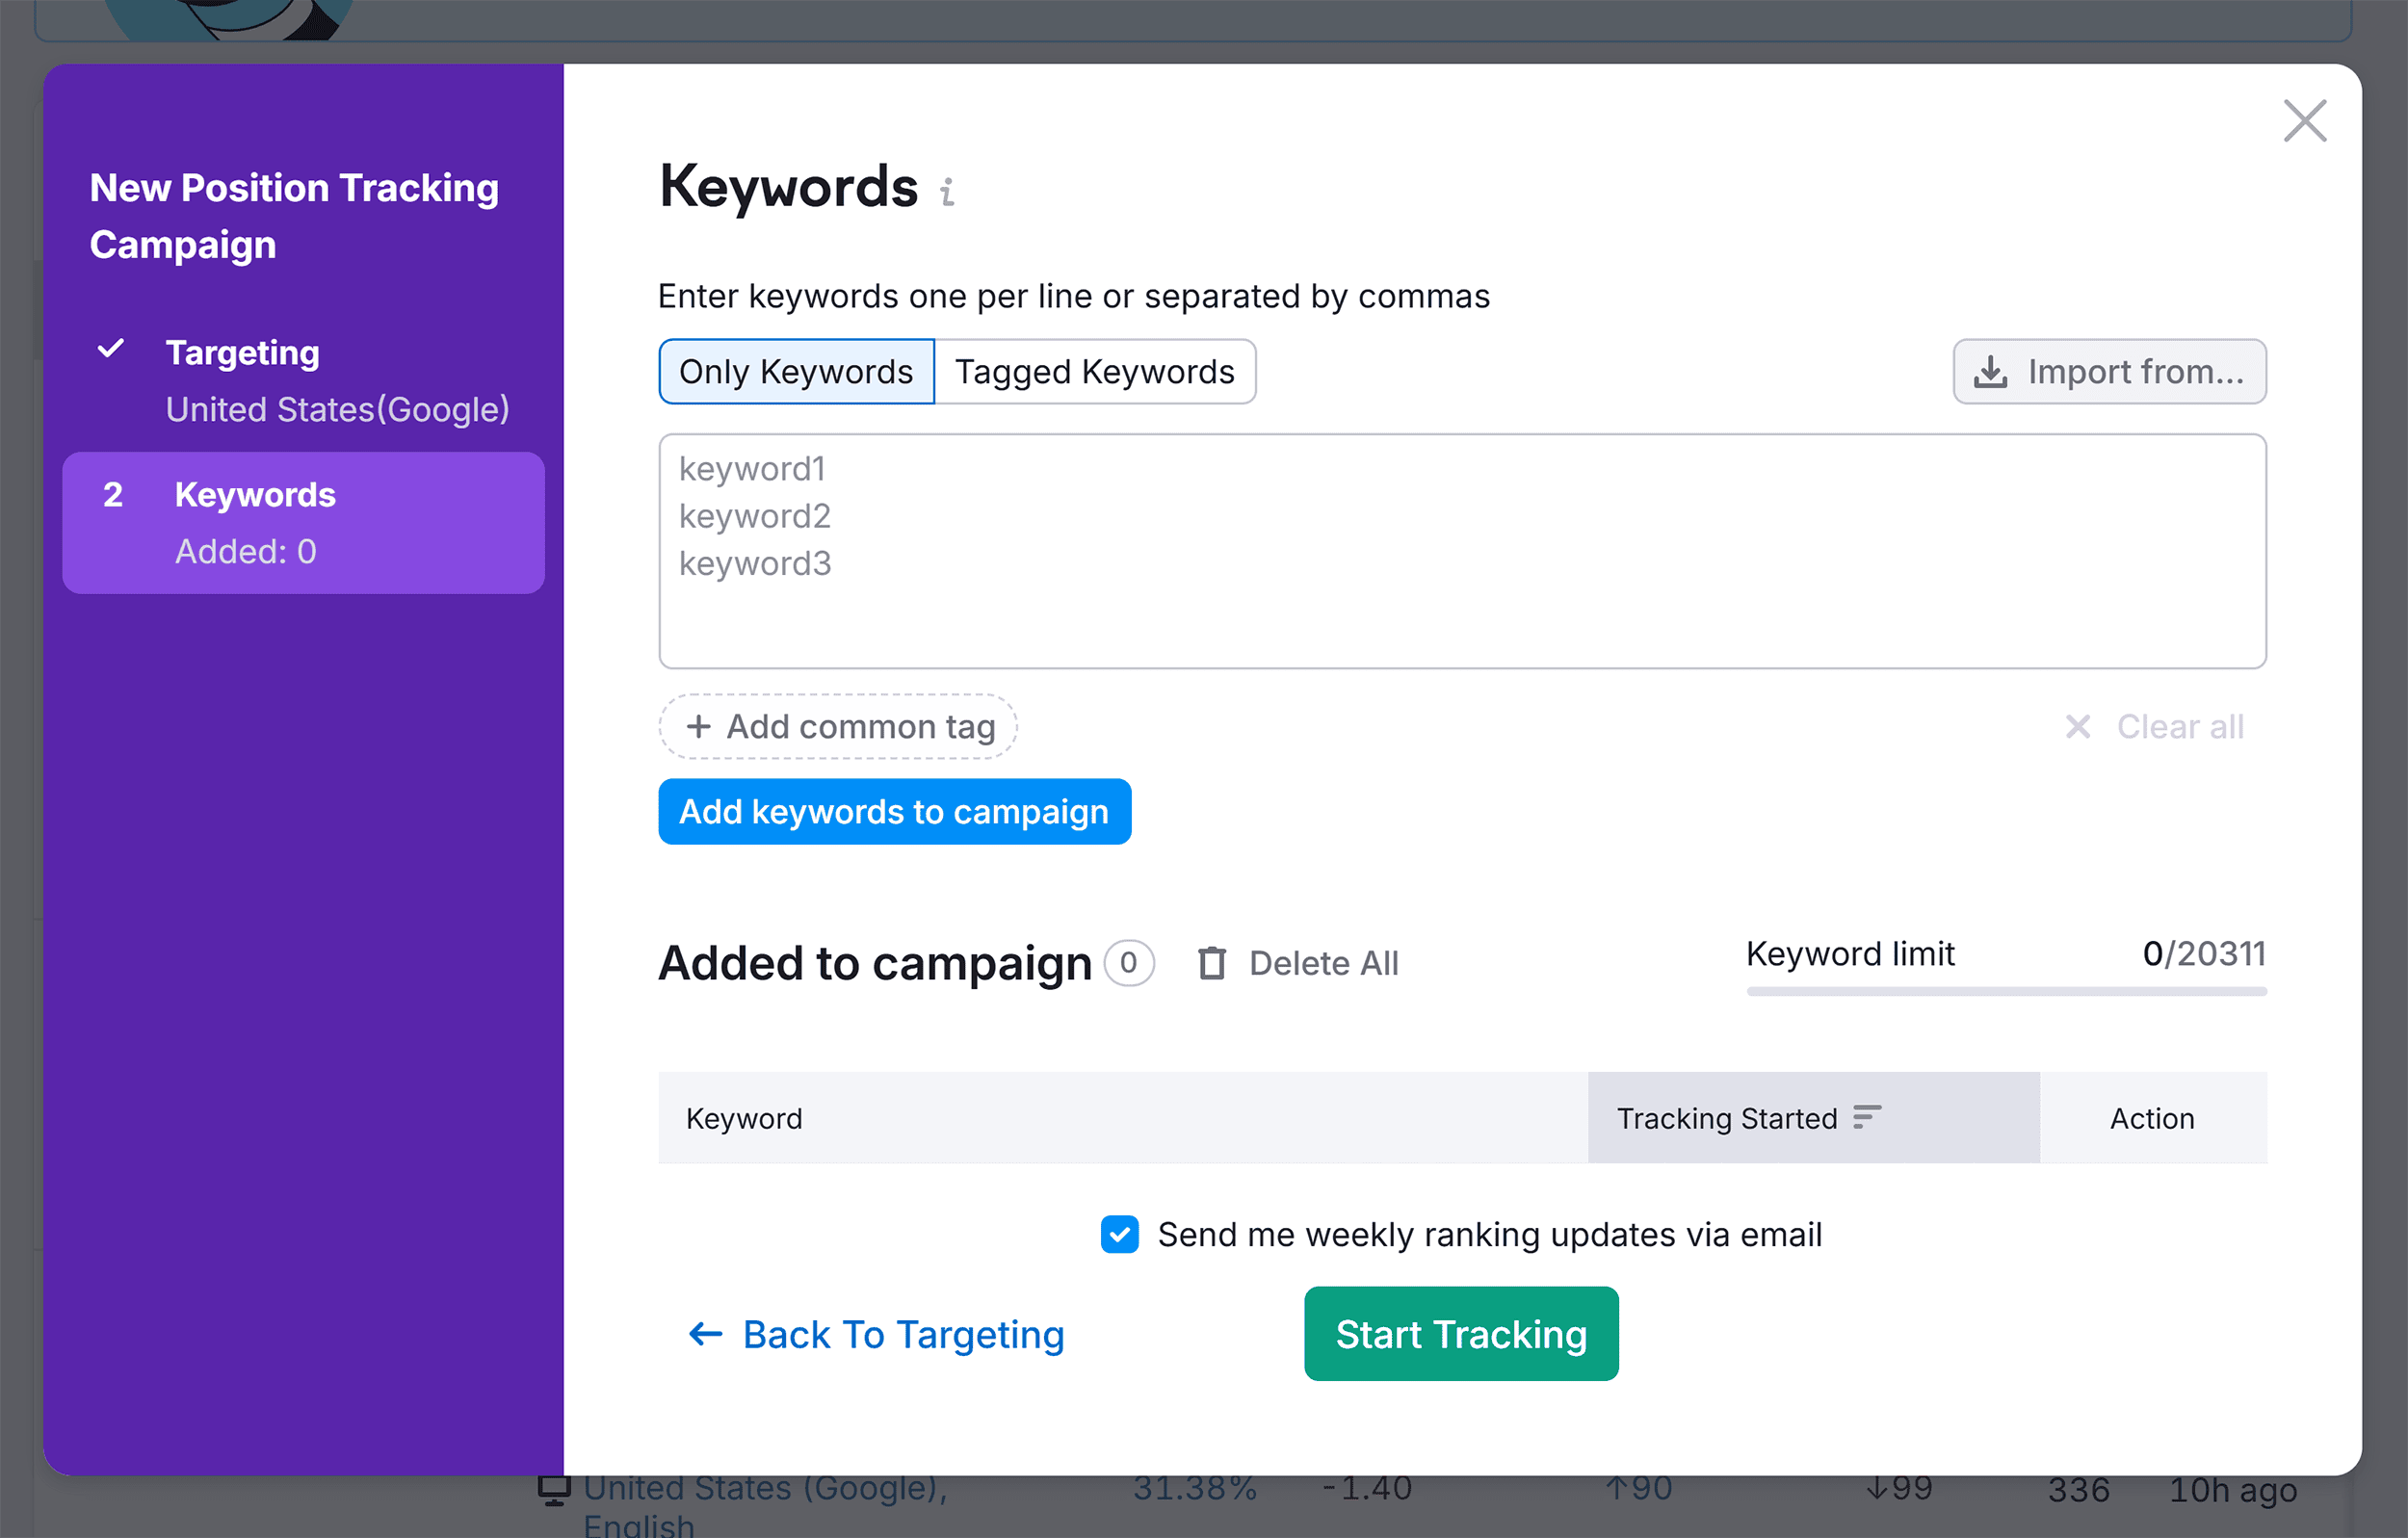
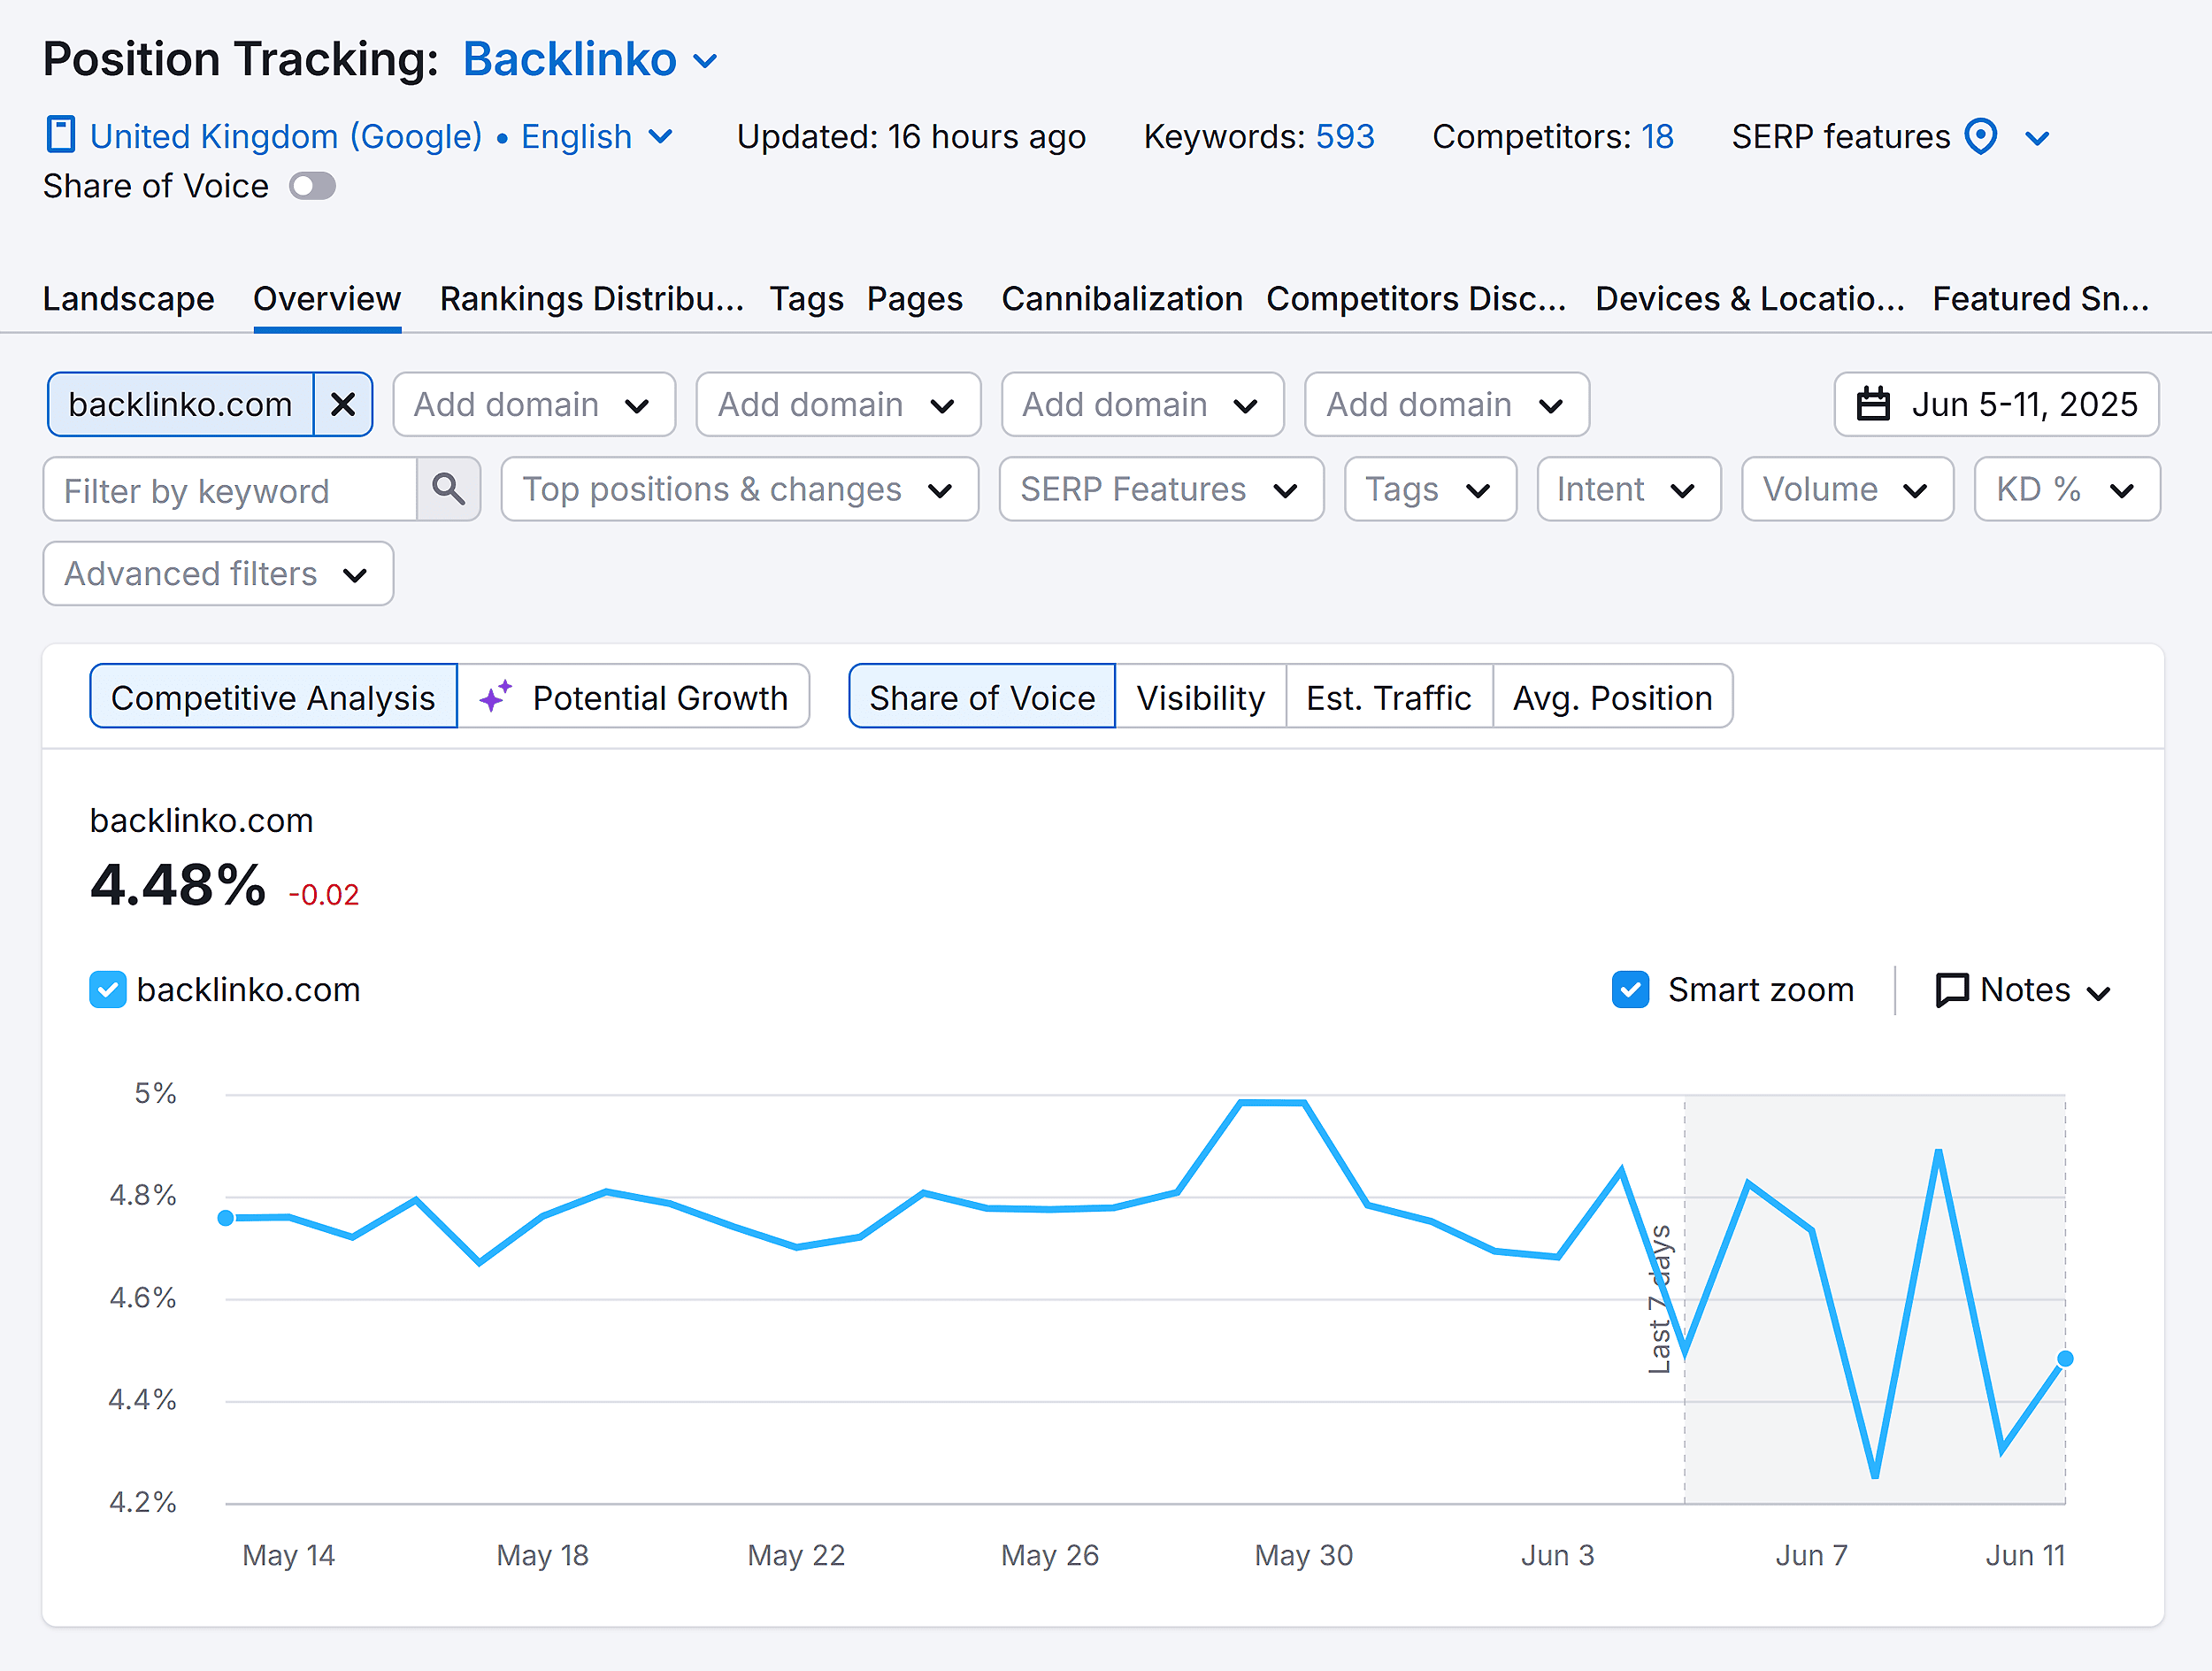
1. Pulling SEO Data: Begin by extracting keywords where your brand already possesses visibility. Google Search Console (GSC) is an invaluable resource, as it provides impression data—every instance your brand appeared in search results, regardless of clicks. By sorting queries by impressions in GSC’s "Performance" report, marketers can identify high-visibility terms. Similarly, exporting high-converting or high-CTR keywords from Google Ads can enrich this list. Tools like Semrush Position Tracking can then be used to automate the ongoing monitoring of these keywords, allowing for the addition of competitor domains to track their performance across the same keyword set.
2. Layering in Competitor Intelligence: To identify opportunities and competitive gaps, it’s crucial to analyze competitor data. Tools like Semrush’s Keyword Gap analysis can highlight keywords where competitors are ranking but your brand is not, indicating validated search demand that should be targeted. For instance, if competitors rank highly for "Gantt chart software" or "team collaboration tools," these represent critical terms for the project management software to target.

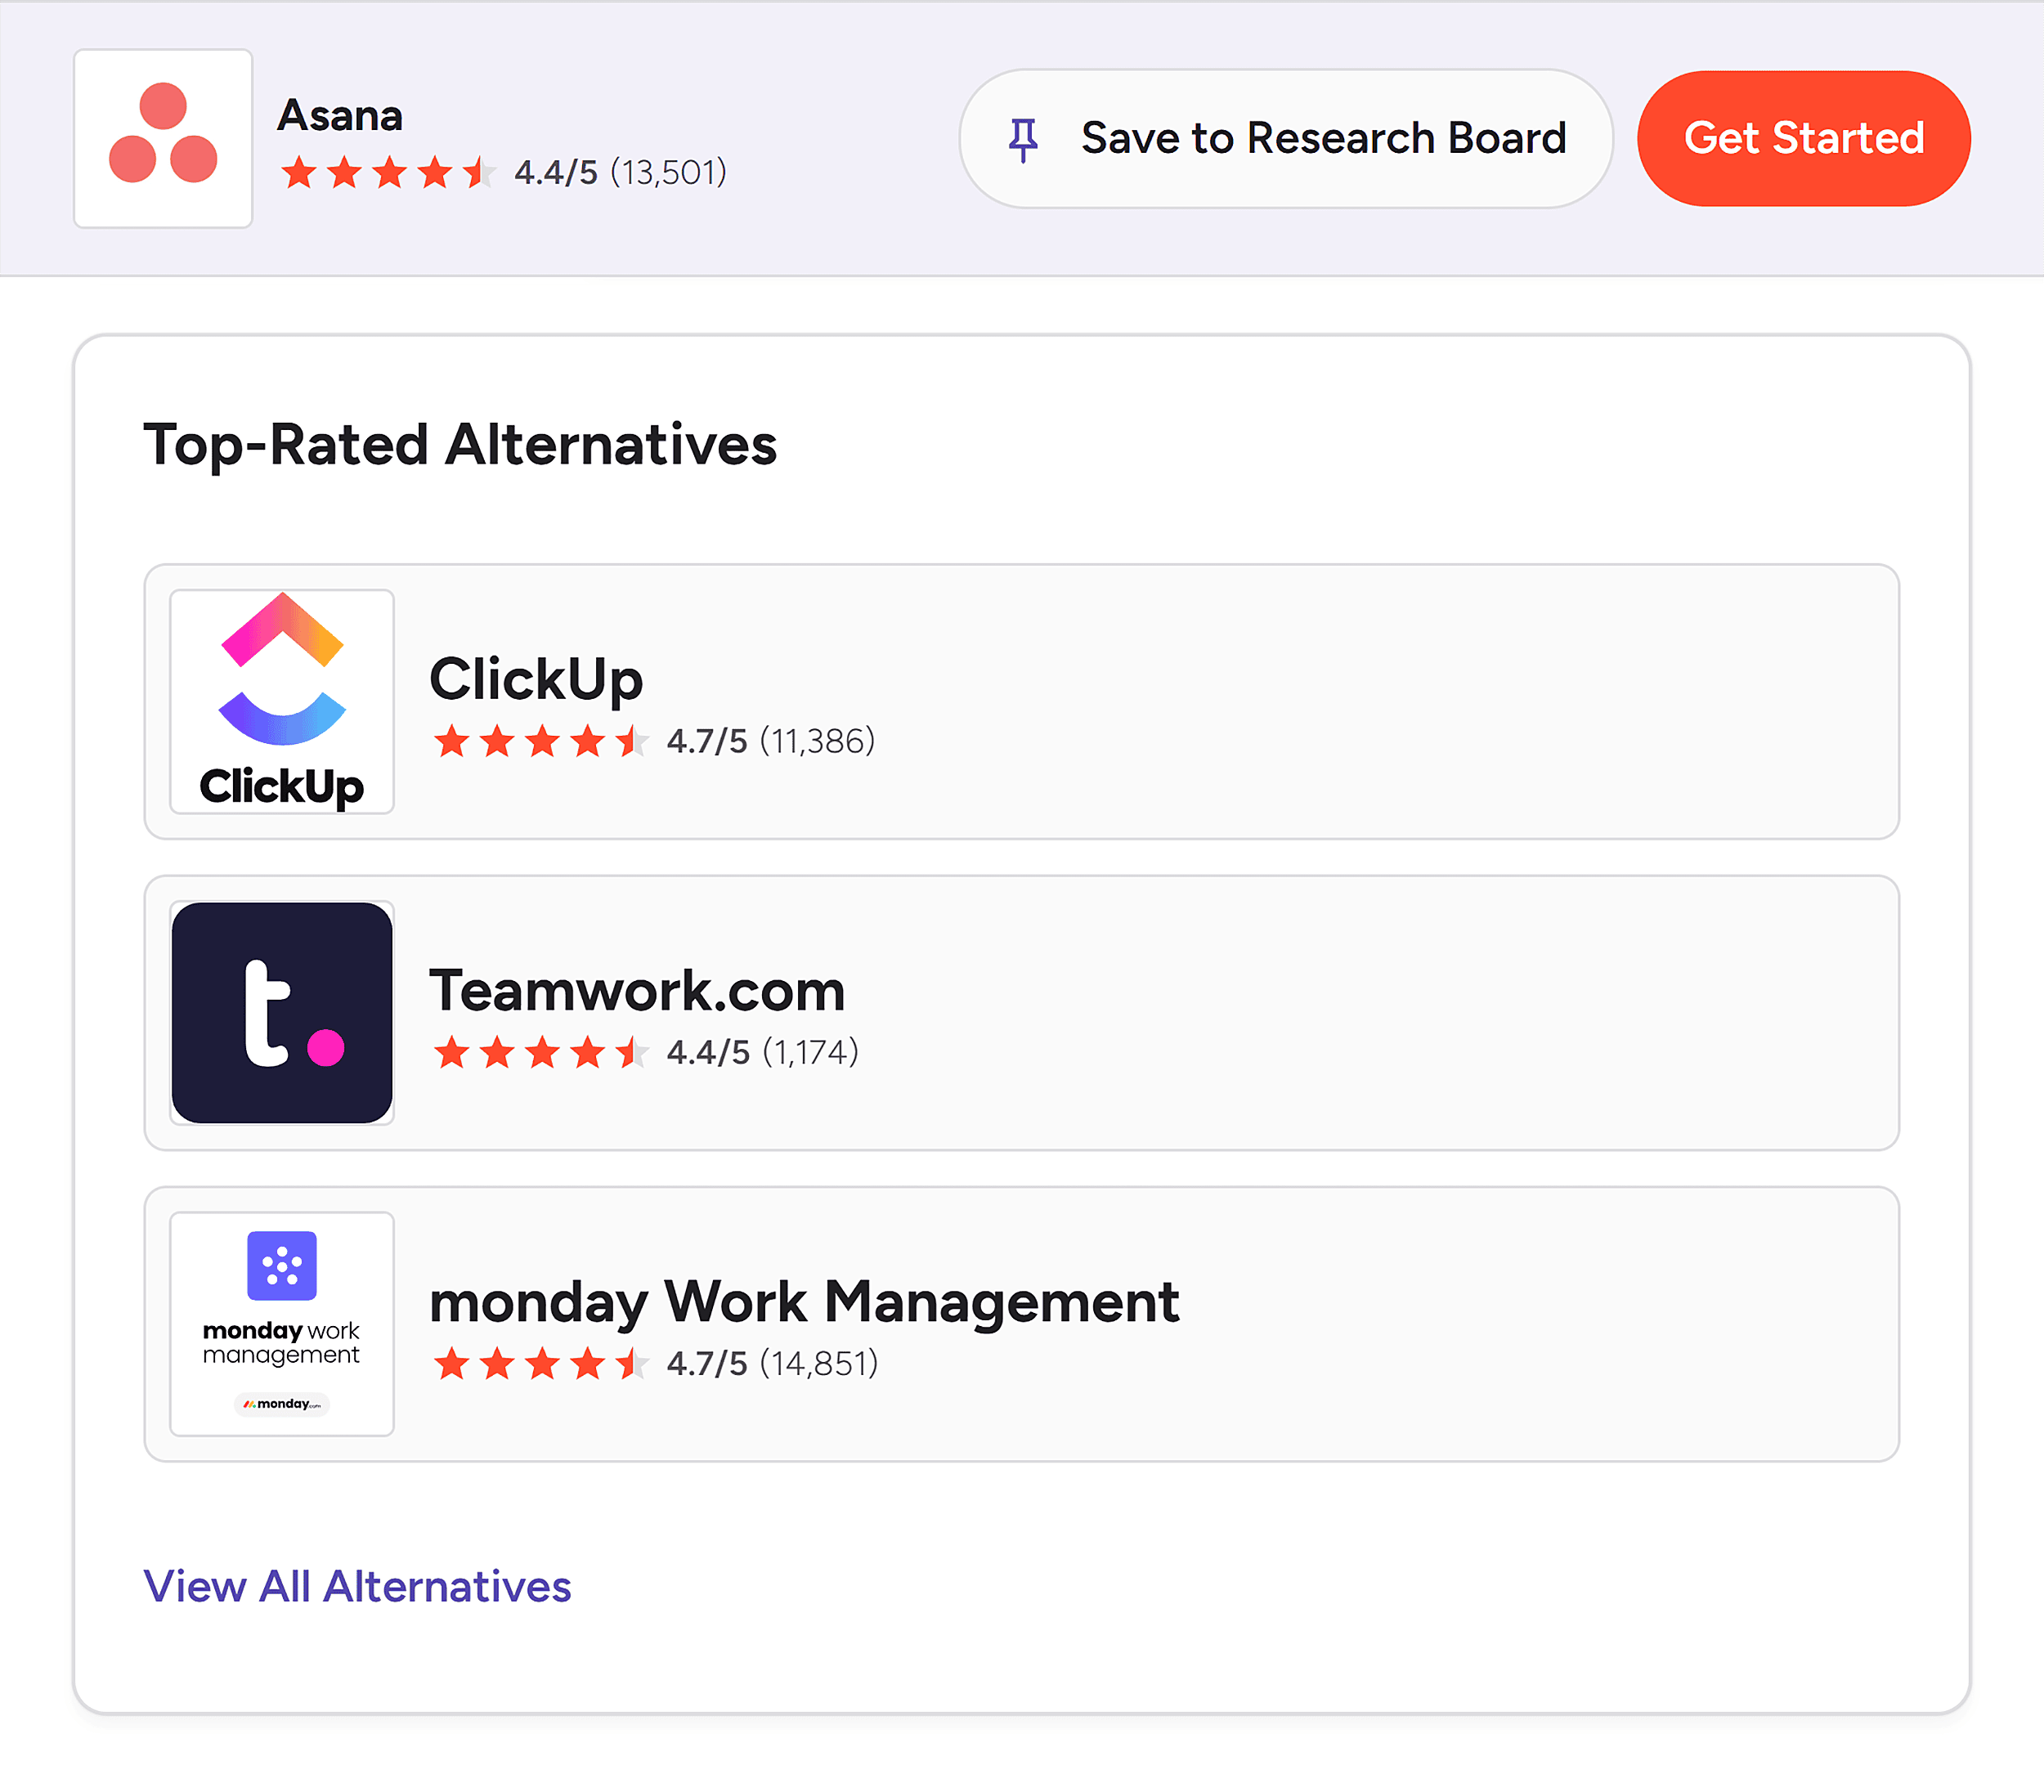
3. Building the AI Prompt Library: AI search queries tend to be more conversational and often mirror discussions in online communities. Therefore, building an AI prompt library involves delving into platforms like Reddit, Facebook groups, and industry-specific Slack communities. Observing how audiences phrase their needs and pain points provides rich fodder for AI prompts. A Reddit post asking for "user-friendly project management tools for small creative agencies" can directly translate into an AI prompt like "What’s the most intuitive project management tool for creative teams?"
For decision-stage prompts, review sites like G2 and Capterra are goldmines. They often list direct comparisons ("Your Brand vs. Competitor") and "alternatives to [Competitor]," which are prime candidates for AI queries. Advanced tools like Semrush AI Visibility Toolkit can further assist by identifying prompts where competitors appear in AI answers but your brand does not, uncovering direct opportunities for AI optimization.
4. Documenting Metadata: All collected data—keywords, prompts, competitors, and their associated funnel stages and clusters—should be meticulously organized in a master spreadsheet. This metadata transforms raw data into a strategic asset, enabling informed decisions on which clusters to prioritize, which funnel stages require attention, and where SEO and AI visibility might diverge.
Calculating SEO and AI Share of Voice
Once the libraries are built, the next step is to calculate SoV for both organic and AI search.

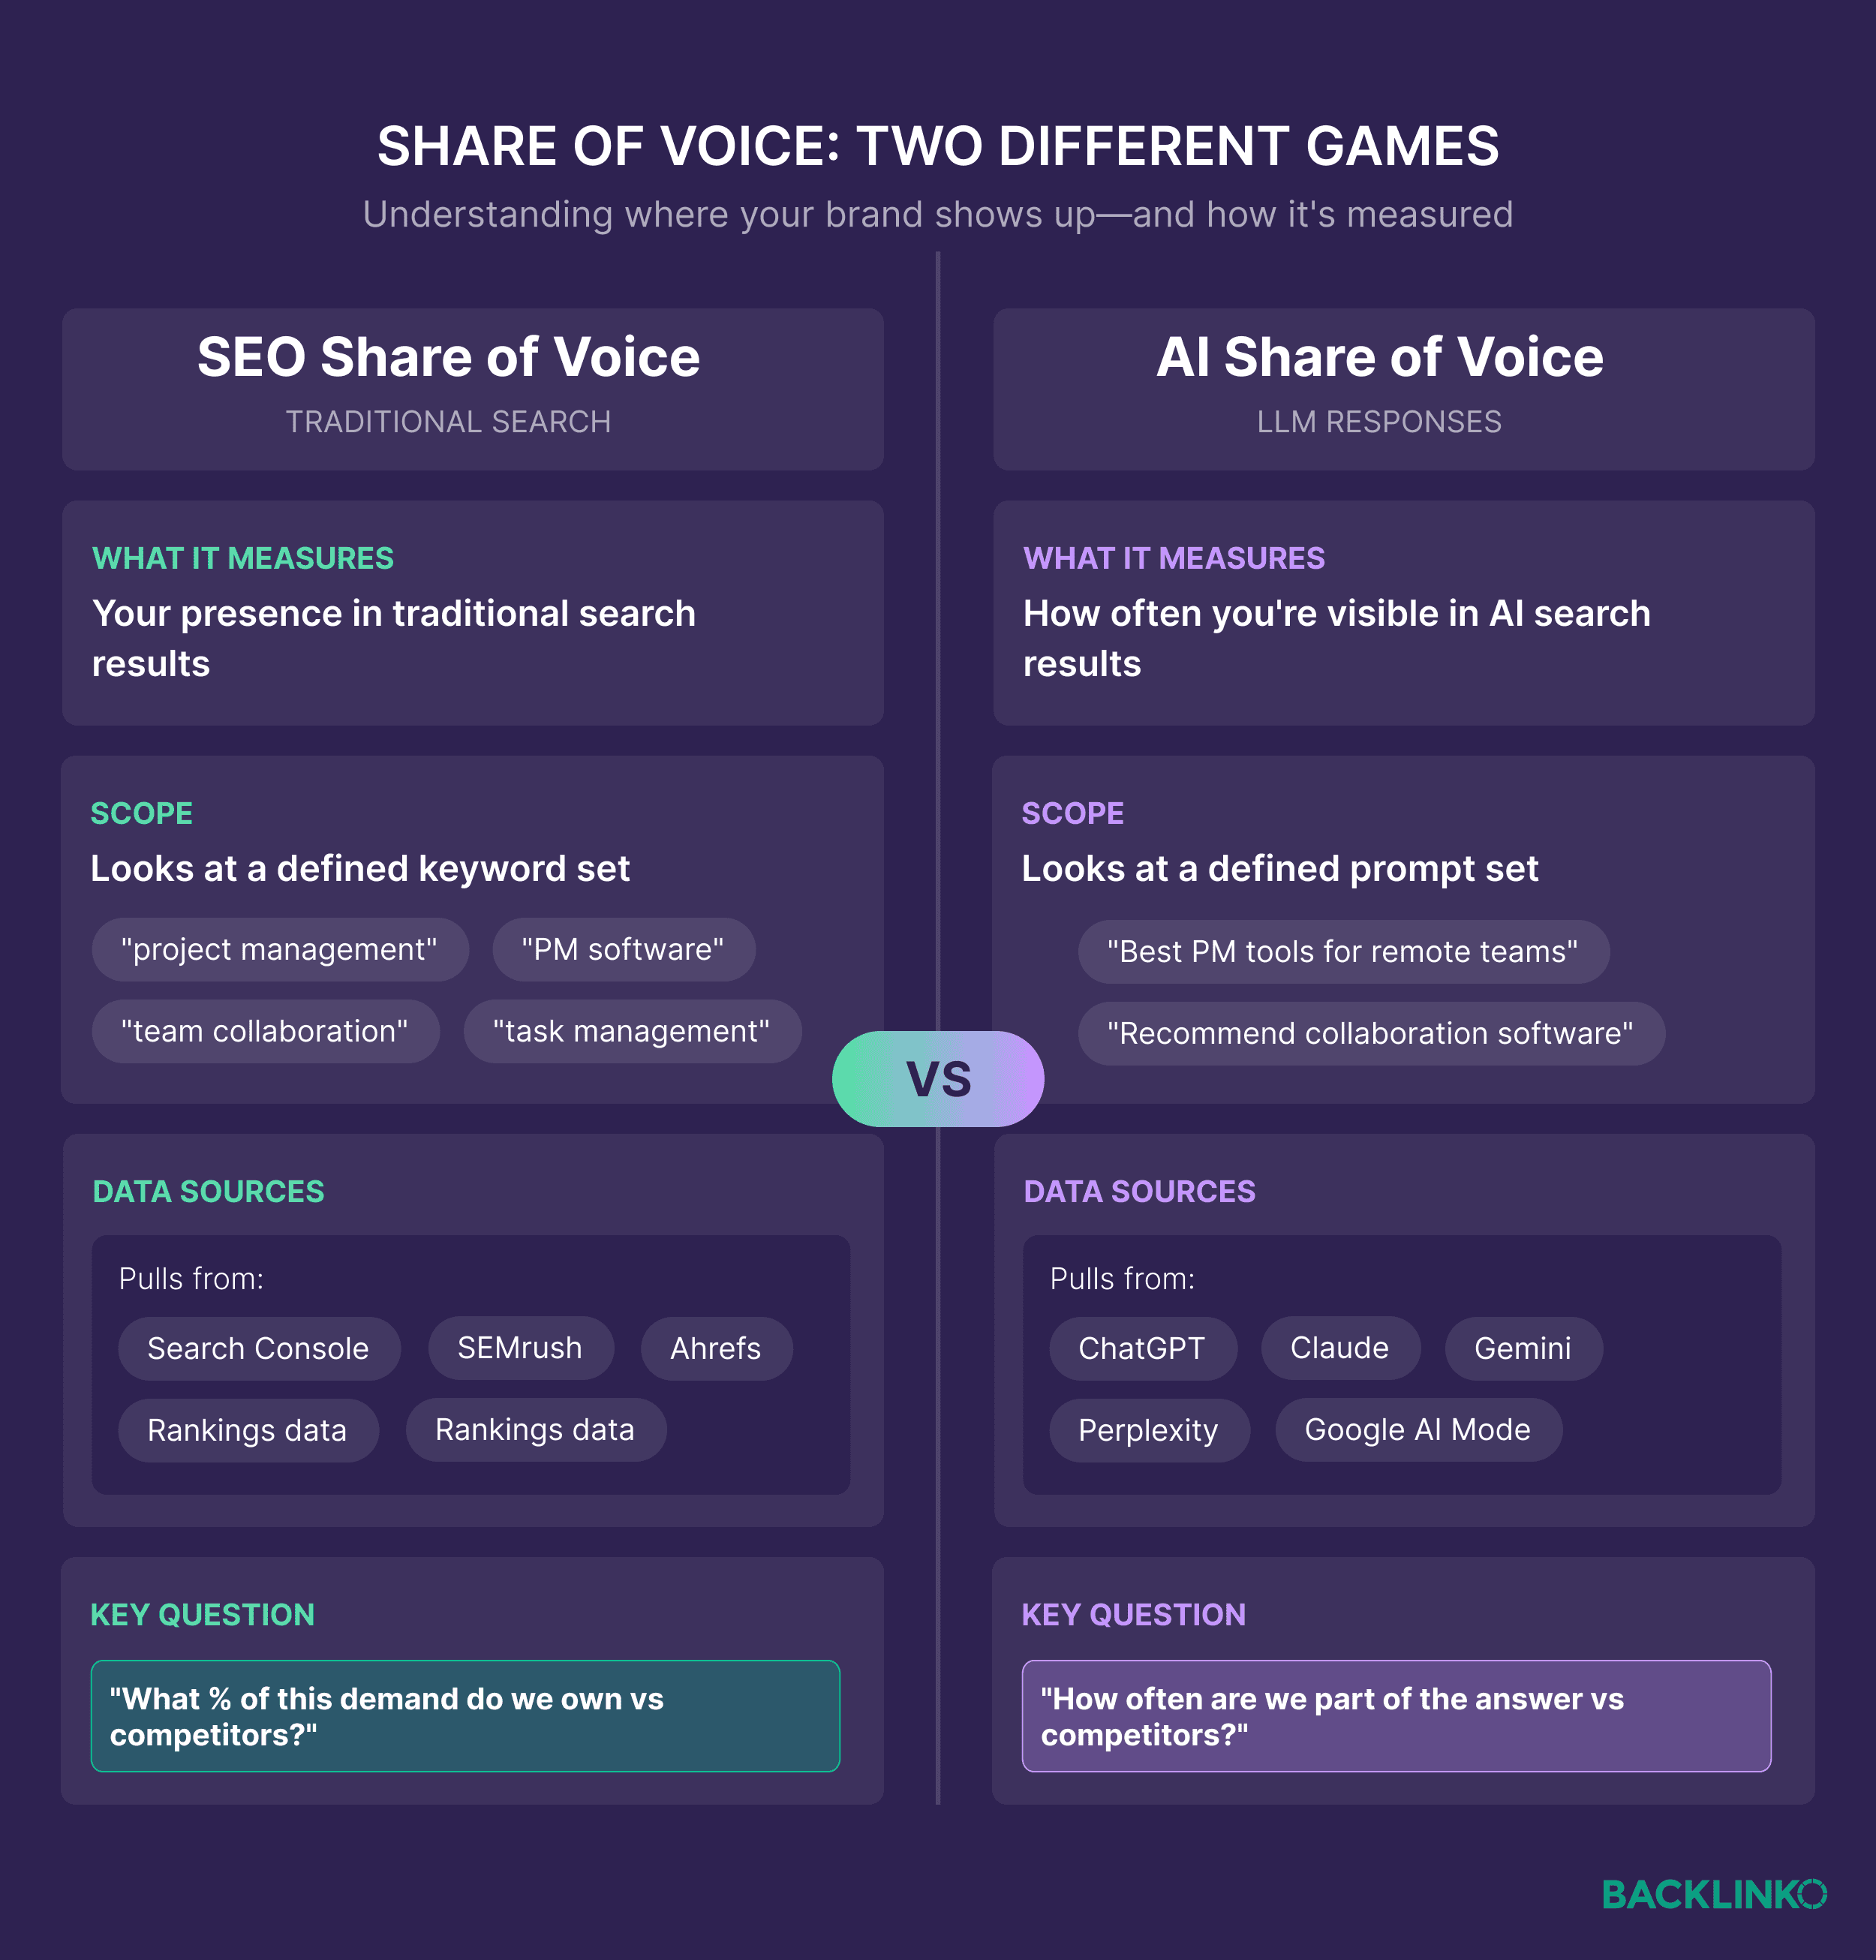
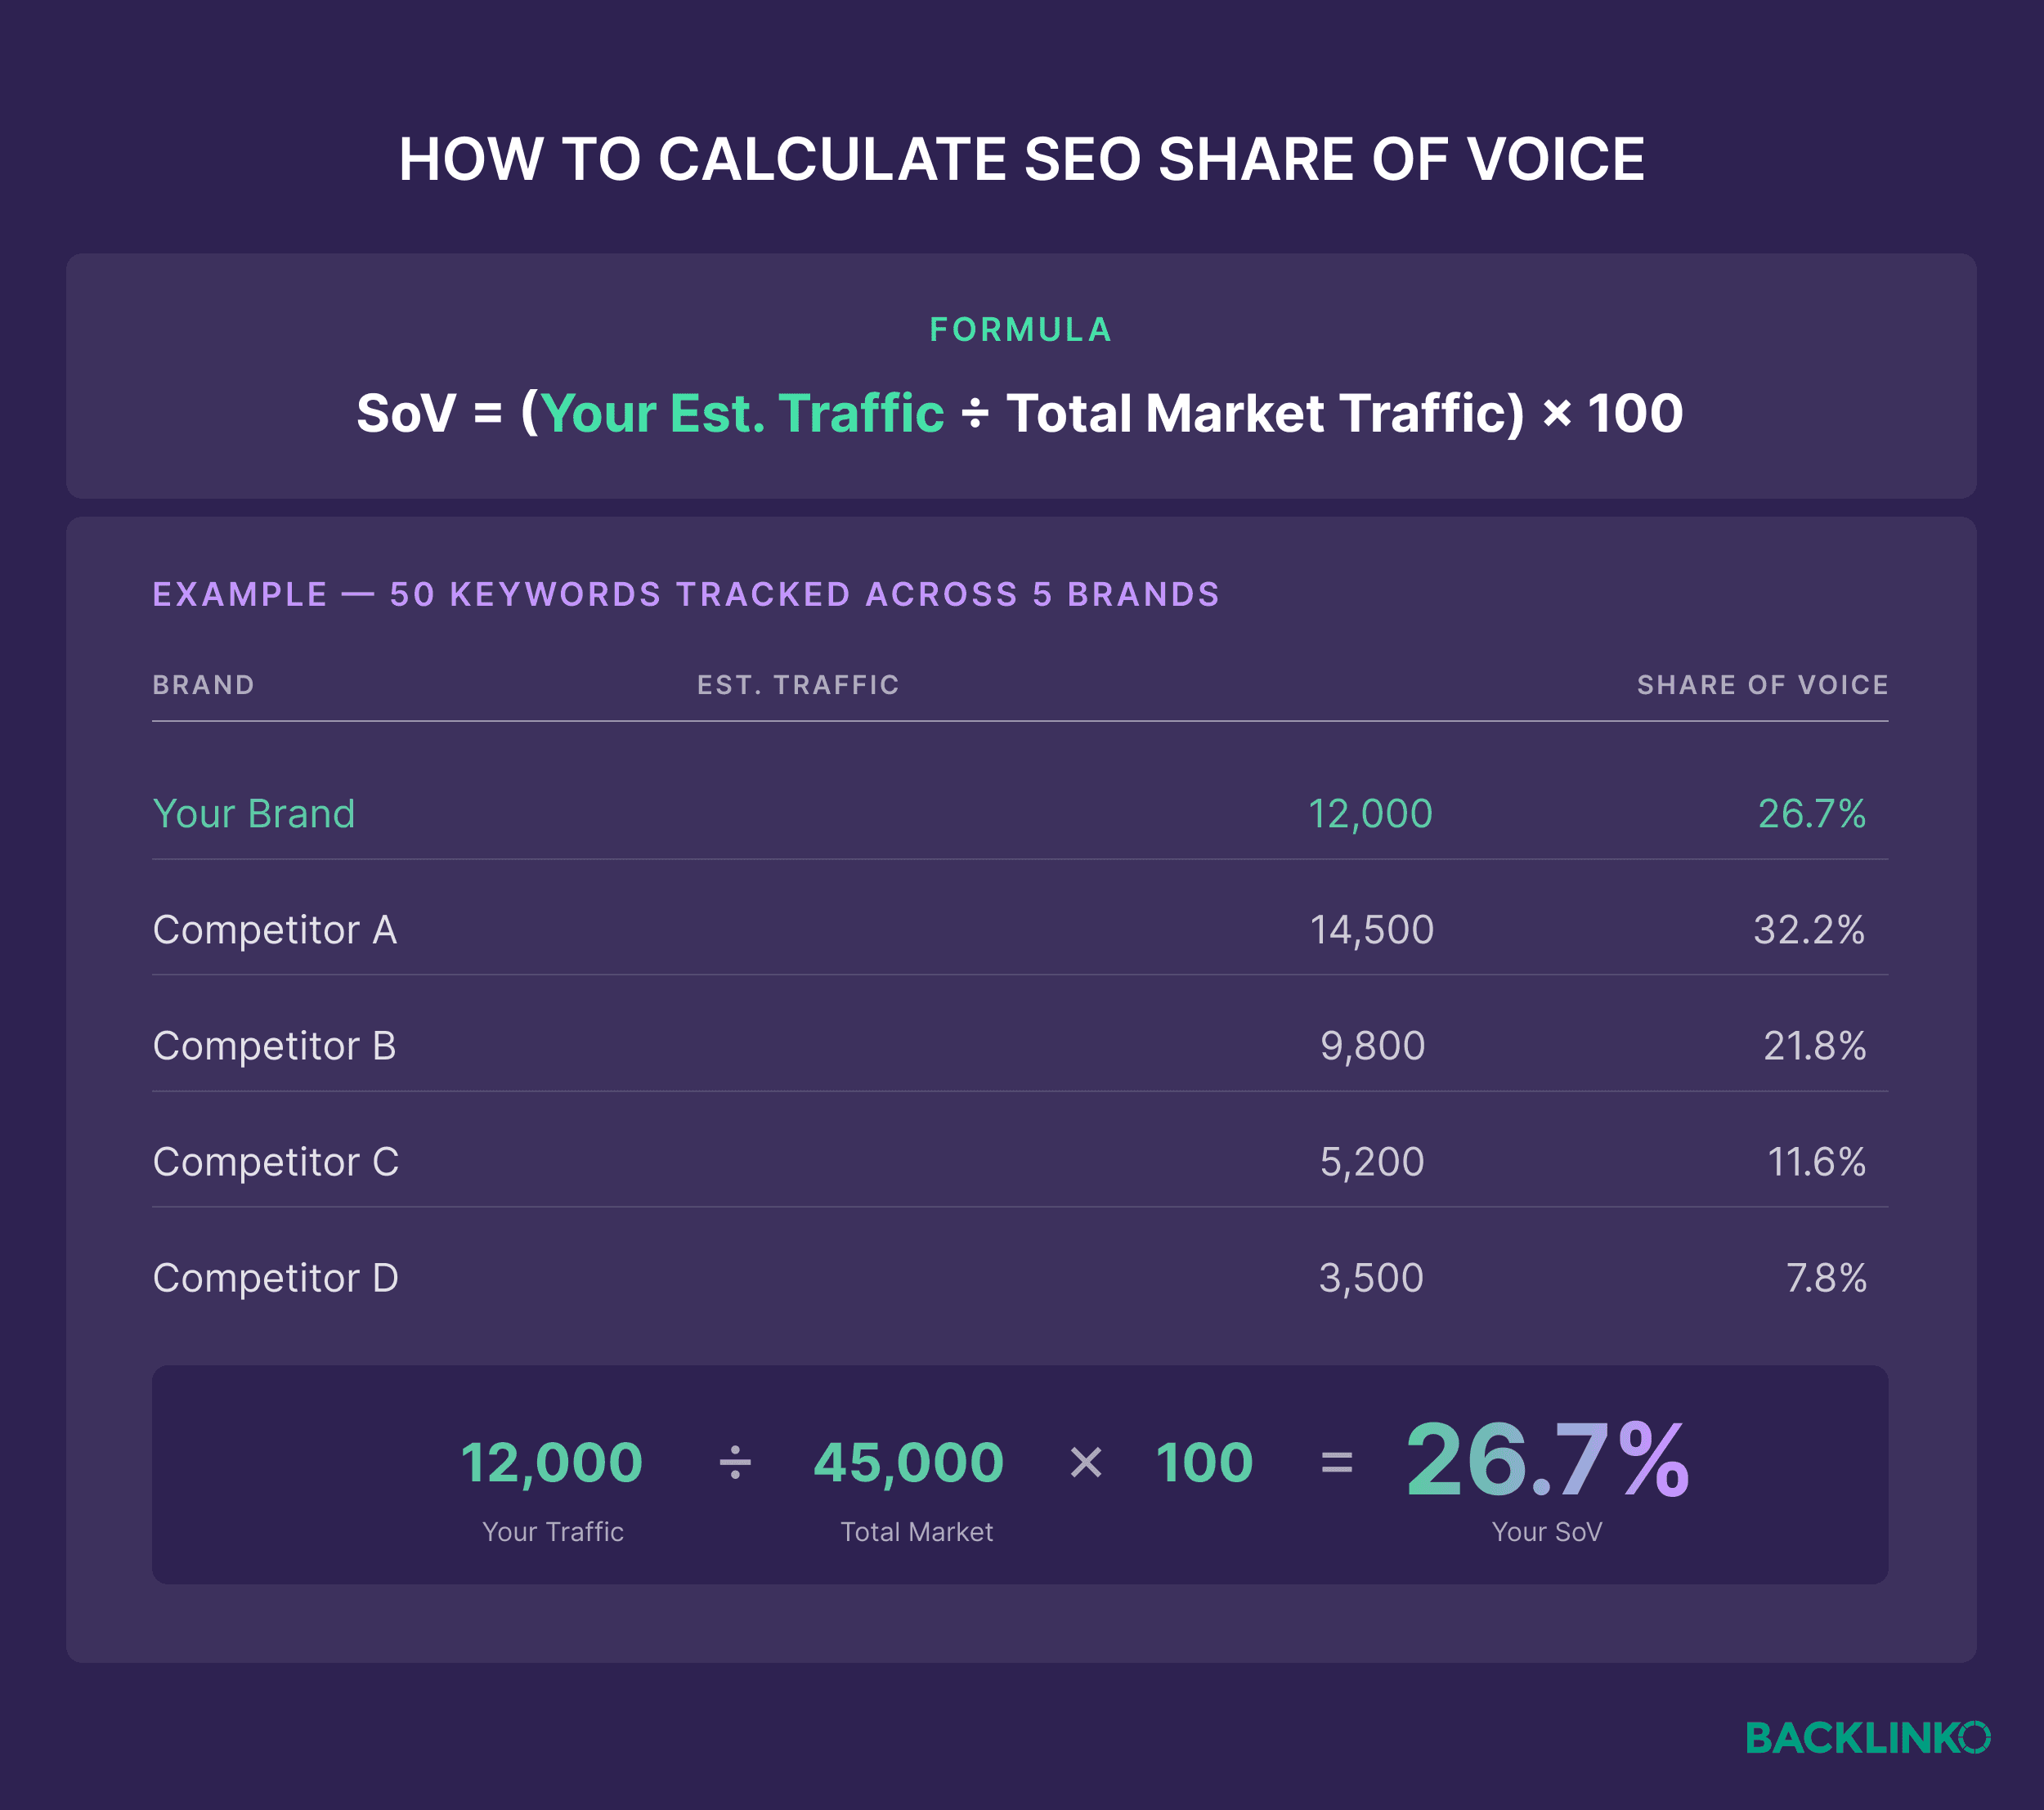
1. Calculating SEO Share of Voice: This involves estimating traffic share based on keyword rankings. Each ranking position carries an average click-through rate (CTR)—e.g., position 1 often garners around 27% of clicks. By multiplying each keyword’s monthly search volume by the CTR for your brand’s ranking position, an estimated traffic figure per keyword can be derived. Summing these estimates across all tracked keywords for all competing brands, then dividing your brand’s total by the collective total, yields your SEO SoV percentage. This manual calculation can be extensive, which is why platforms like Semrush automate this process by tracking daily rankings and aggregating data into SoV percentages for multiple domains simultaneously.
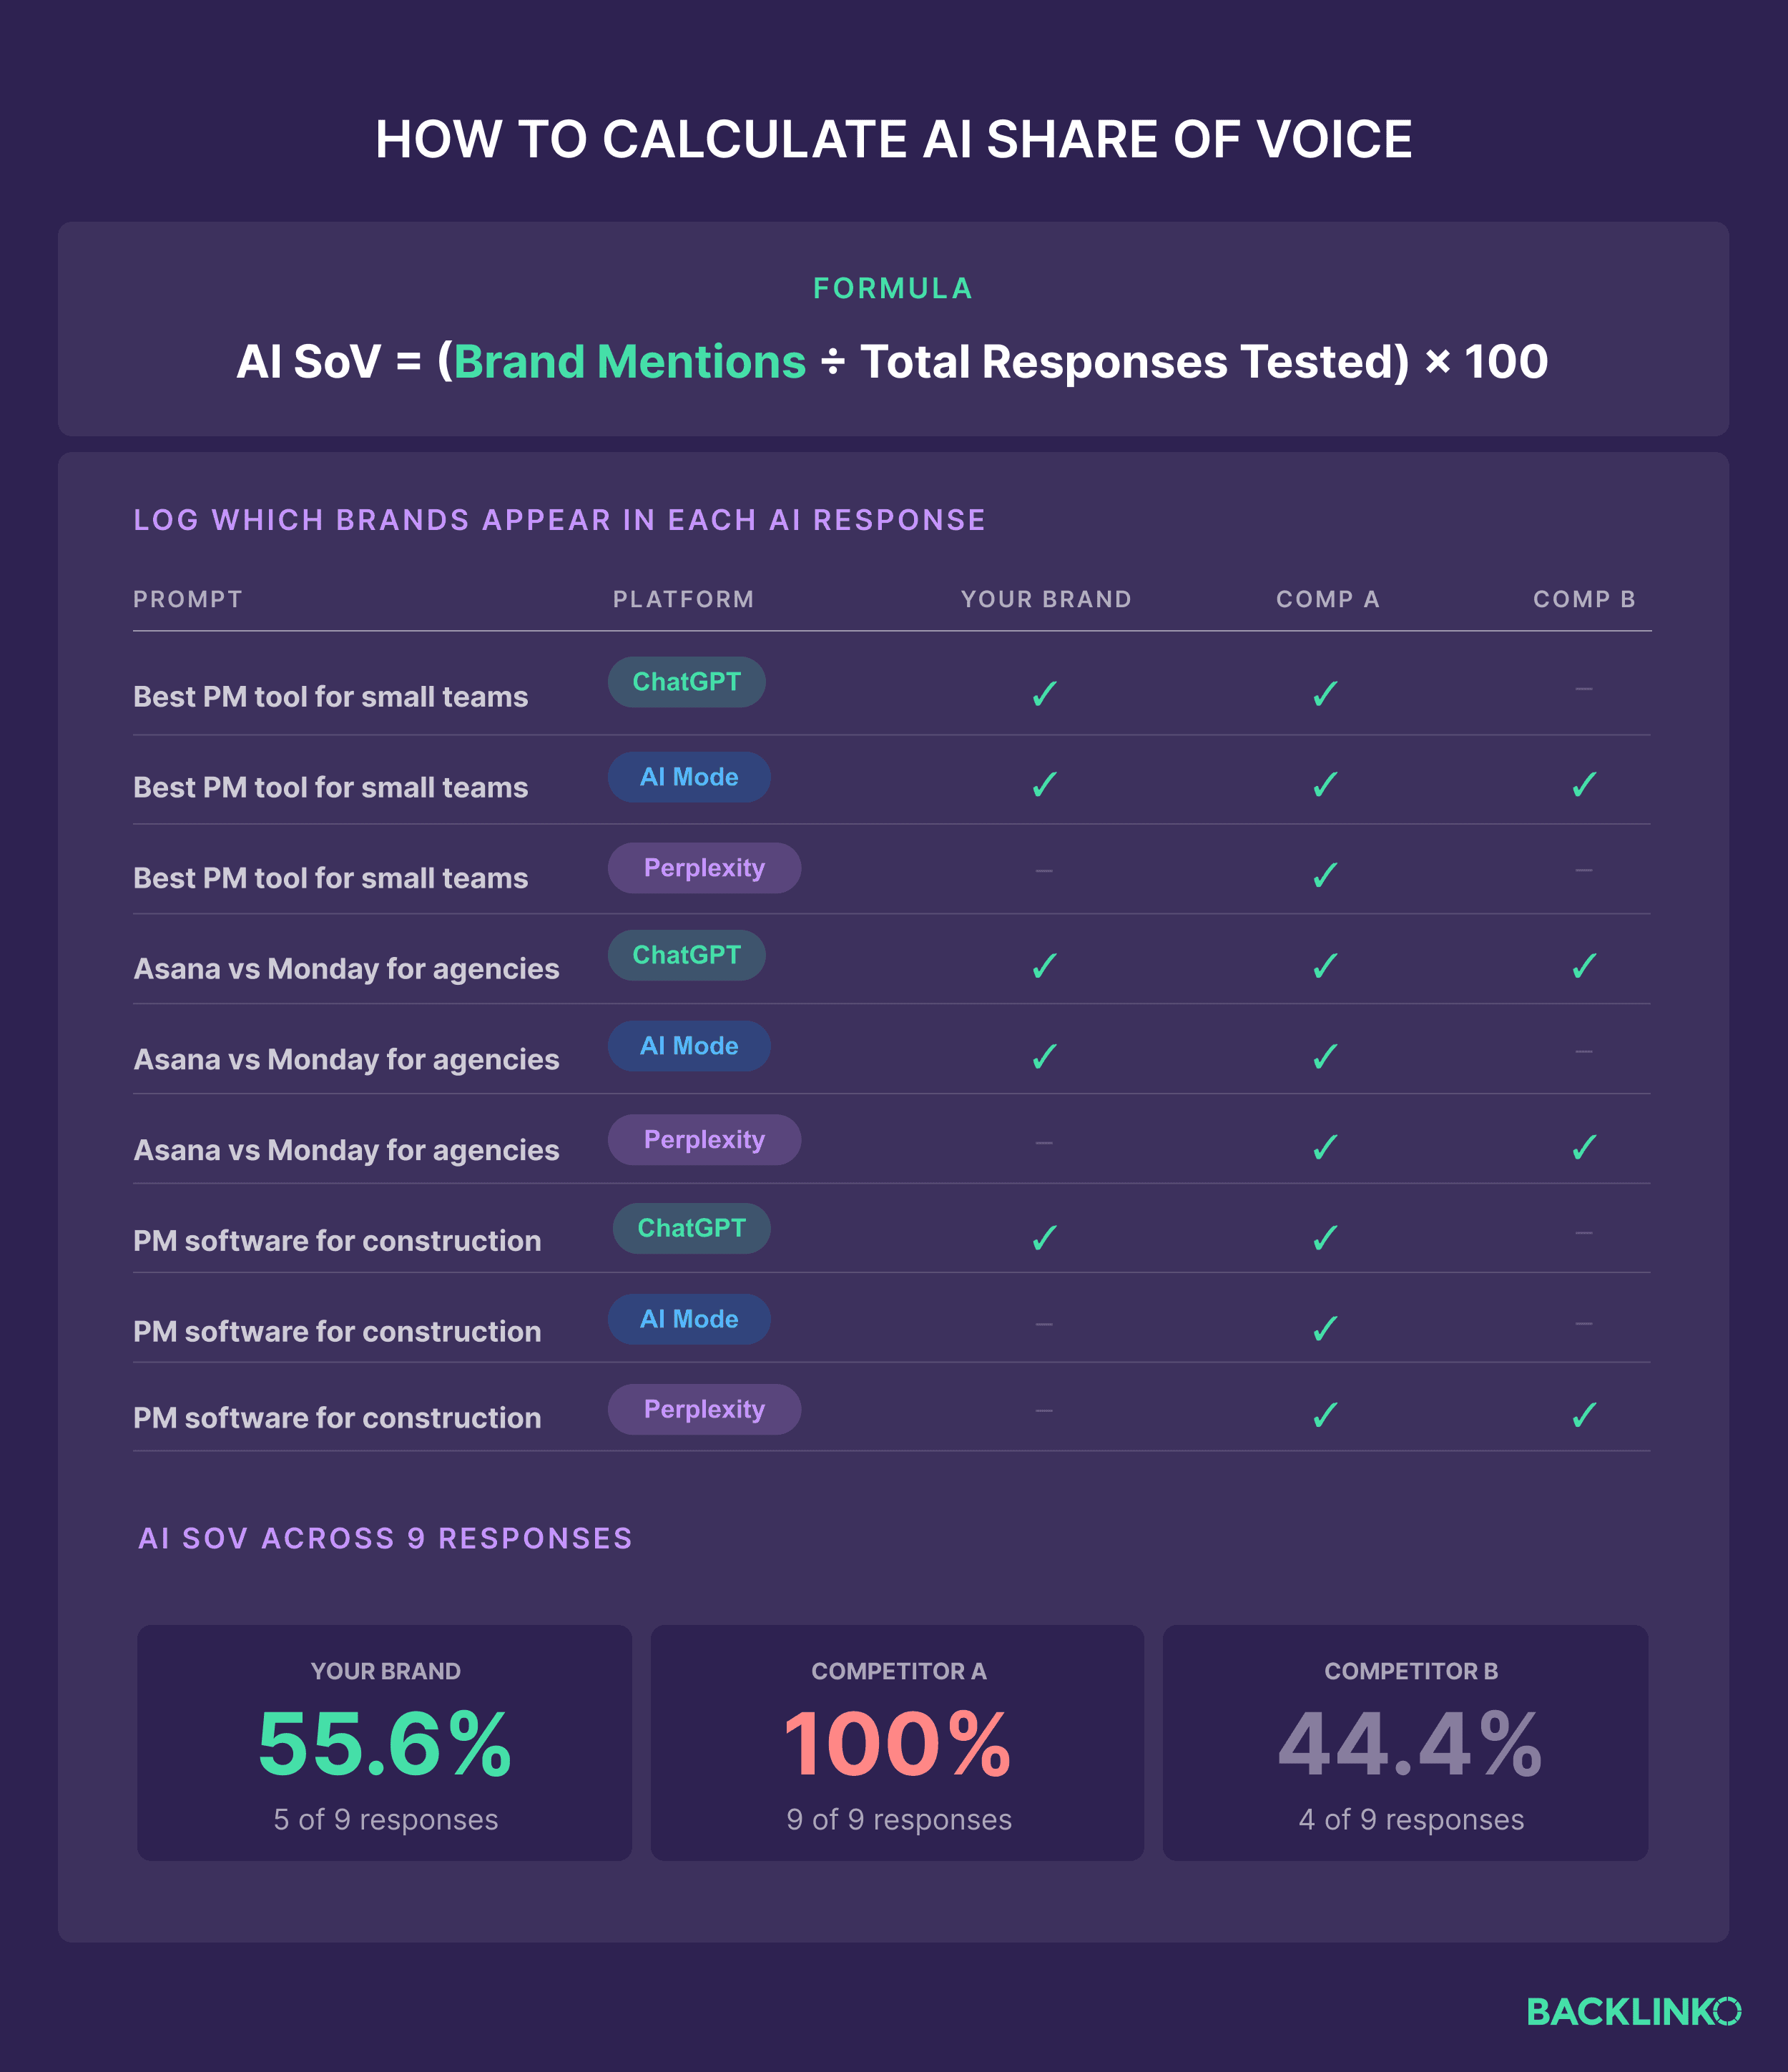
2. Calculating AI Share of Voice: Measuring AI SoV quantifies how frequently LLMs mention or cite a brand in response to category-related prompts. While a standardized manual measurement is still evolving, a directional read can be achieved by:
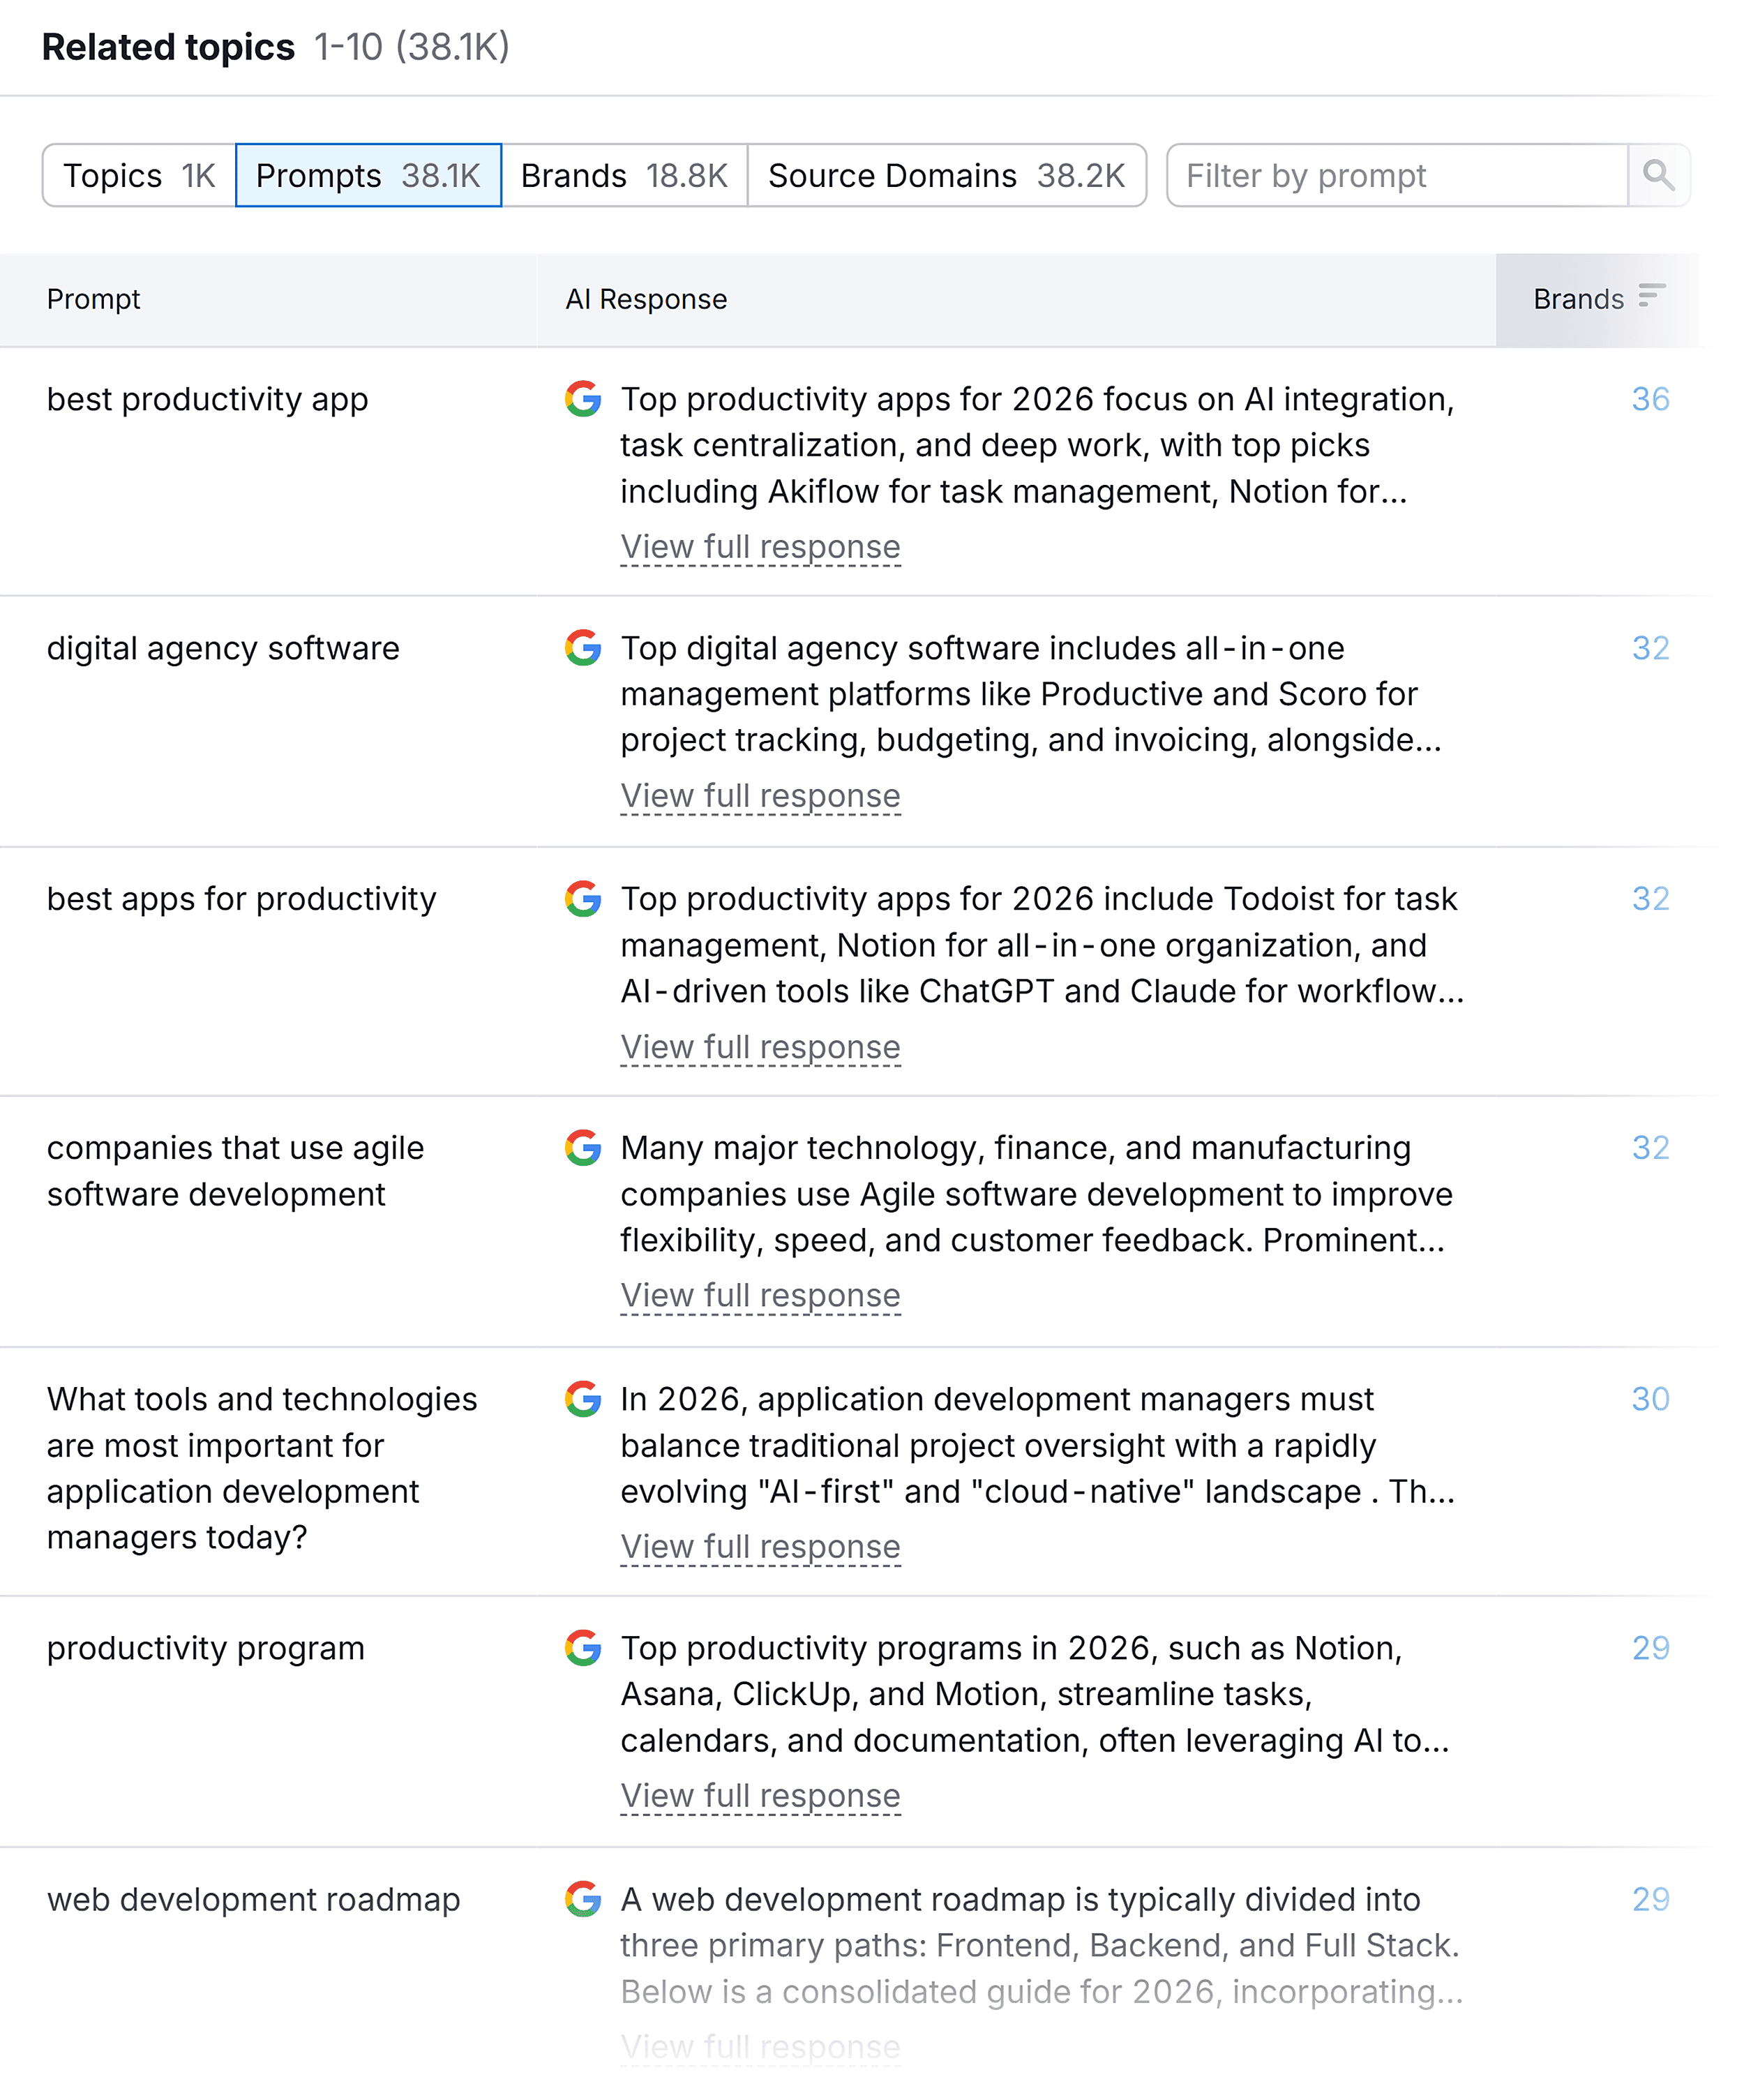
- Running all compiled AI prompts through relevant LLMs (e.g., ChatGPT, Google AI Mode, Perplexity).
- Documenting every instance each brand is mentioned or cited.
The AI SoV is then calculated by dividing a brand’s total mentions/citations by the total number of prompts tested, multiplied by 100. It’s crucial to acknowledge that AI responses can vary by session, phrasing, location, and platform, necessitating regular testing to track trends rather than seeking a static, precise metric. Tools like Semrush’s AI Visibility Toolkit automate this complex process by testing hundreds of prompts, analyzing AI responses for mentions, sentiment, and citations, and then aggregating this data to provide a comprehensive AI SoV percentage. It also highlights key business drivers (frequently mentioned topics) where a brand might be stronger or weaker than its competitors.
Interpreting Your Share of Voice: Actionable Insights
The interplay between SEO SoV and AI SoV provides a nuanced understanding of brand performance. These two metrics may not always align, revealing different aspects of a brand’s digital presence. A brand could have a high organic search ranking for many keywords (high SEO SoV) but be rarely cited by LLMs (low AI SoV) if its content lacks the credibility or structure AI models value. Conversely, highly authoritative content might be frequently cited by AI even without top organic rankings, indicating a strong AI SoV.
| A simple matrix helps interpret these scenarios: | High AI SoV | Low AI SoV | |
|---|---|---|---|
| High SEO SoV | You dominate both traditional and AI search. Action: Maintain content freshness, expand into adjacent topics, and defend your leading position through continuous content refinement and authority building. | You rank well in organic search, but LLMs don’t cite you. Action: Implement content chunking, structured data, and create highly citable, authoritative assets to optimize content for AI search and build the credibility LLMs value. Focus on E-E-A-T (Experience, Expertise, Authoritativeness, Trustworthiness) signals. | |
| Low SEO SoV | AI tools cite your content even without top organic search rankings. Action: Improve SEO fundamentals (title tags, internal linking, site speed, keyword optimization) to translate AI-driven credibility into traditional search visibility. Leverage AI insights to refine organic content strategy. | Focus on depth over breadth. Action: Create definitive, well-researched content resources for every core cluster. This foundational effort is crucial for building visibility across both traditional and AI search, ensuring your brand becomes a go-to source of information. |
Establishing Your Baseline and Tracking Trends
The final, critical step is to integrate SoV into an ongoing tracking and decision-making system. A baseline dashboard should capture three levels of detail:
- Overall SoV: The brand’s total SoV across all tracked channels.
- SoV by Channel: Breakdowns for organic search, AI search, social, etc.
- SoV by Segment: Further segmentation by topic cluster, funnel stage, or competitor.
Establishing a regular tracking cadence—monthly for spotting trends and quarterly for deep dives—is vital. Quarterly reviews allow for:
- Identifying emerging competitors: Who is gaining ground and where?
- Uncovering new buyer needs: What new keywords or prompts are gaining traction?
- Assessing content performance: Which content types are driving the most SoV?
This rhythm prevents reactive chasing of short-term fluctuations and enables strategic responses to significant market shifts.
Translating SoV into Growth: Strategies for Enhanced Visibility
SoV isn’t merely a reporting metric; it’s a strategic compass for improving market presence and driving revenue. Not every fluctuation demands immediate action, but critical gaps and competitive threats require targeted interventions.
Targeting Unseen Opportunities
Clusters with exceptionally low SoV (e.g., <10%) signal near invisibility, particularly damaging in decision-stage queries. If a brand isn’t appearing when buyers search for "best [product/service]," it’s effectively out of the consideration set. Simultaneously, identifying areas where competitors dominate but your brand has a unique value proposition presents a clear opportunity. For instance, if the project management software serves creative agencies but has zero visibility for "project management for creative teams," this is a high-impact, low-effort gap to close.
Potential Solutions:
- Build Topical Authority: Develop comprehensive "pillar pages" supported by multiple detailed articles around major business themes. This establishes deep expertise, which is highly valued by both search engines and LLMs.
- Prioritize Comparison Content: Create dedicated pages comparing "[Your Brand] vs. [Competitor]" and comprehensive category buyer’s guides. This directly addresses decision-stage queries.
- Optimize for Featured Snippets and AI Overviews: Structure content to provide clear, concise answers that can be easily extracted by AI, increasing the likelihood of appearing in zero-click results.
Optimizing for Conversion, Not Just Clicks
A high SoV is only valuable if it translates into business outcomes. If a cluster like "what is project management" yields high SoV but only a 1% conversion rate, it indicates an efficiency problem: resources are being spent on an audience unlikely to convert, while high-intent buyers might be overlooked.
Potential Solutions:
- Reallocate Resources: Shift budget and content creation efforts towards high-intent clusters and bottom-of-funnel content (e.g., case studies, ROI calculators, detailed product pages).
- Refine Content Strategy: Audit existing content for conversion potential. Update comparison pages with current data and competitive intelligence, ensuring they clearly articulate unique selling propositions.
- Enhance Call-to-Actions (CTAs): Ensure all high-visibility content includes clear, compelling CTAs tailored to the user’s funnel stage.
Countering Competitive Incursions
Vigilantly tracking competitors gaining ground in your strong clusters is essential. A 5% increase in a competitor’s SoV within a key cluster can be an early warning sign of an encroaching threat to your market share.

Potential Solutions:
- Optimize Review Profiles: If competitors are winning on review sites, actively manage and optimize your brand’s profiles on platforms like G2 and Capterra. Implement campaigns to solicit authentic reviews from satisfied customers.
- Engage in Communities: Proactively participate in relevant online communities (Reddit, Slack, industry forums) where competitors are visible. Provide valuable insights and position your brand as a helpful resource.
- Content Refresh and Expansion: Regularly update and expand existing high-performing content to maintain relevance and authority, especially in the face of new competitive content.
Prioritization based on an effort-vs.-impact matrix is key. High-impact, low-effort wins (e.g., optimizing existing comparison pages) should be tackled first, followed by more substantial, high-effort investments (e.g., building new topical authority hubs) that promise long-term, compounding returns.
The Future of Brand Strategy: SoV as the Guiding Principle
In an era where brand visibility is increasingly fragmented across diverse digital platforms, and AI-driven information consumption reshapes user behavior, Share of Voice emerges as the definitive metric for gauging and enhancing market presence. It transcends the limitations of traditional traffic data, offering a holistic view of how a brand resonates across the entire buyer journey, whether through a direct website visit or an AI-generated summary.

By meticulously defining industry landscapes, curating comprehensive keyword and prompt libraries, accurately calculating SEO and AI SoV, and establishing robust tracking systems, brands can gain unparalleled clarity into their competitive standing. More importantly, this data empowers them to make strategic decisions that close visibility gaps, optimize efficiency, and counter competitive threats effectively. Share of Voice is not merely a metric; it is a strategic framework that enables brands to remain relevant, influential, and successful in the complex, AI-dominated digital future. It is the North Star for modern marketing, guiding brands toward sustained growth and undeniable market leadership.