The Misleading Visualization of COVID-19 Data and the Challenges of Statistical Literacy in Global Health Reporting

In the wake of the August 3, 2020, interview between President Donald Trump and Axios journalist Jonathan Swan, the discourse surrounding the United States’ handling of the COVID-19 pandemic reached a point of intense scrutiny. The exchange, which took place at the White House, centered on the interpretation of mortality data and the comparative efficacy of the U.S. response versus international counterparts. Following this event, various media outlets, including National Public Radio (NPR), attempted to contextualize the President’s claims by presenting data visualizations. However, an analysis of these graphical representations reveals the significant dangers of selective data filtering—specifically the "top 10" bias—which can inadvertently obscure the broader reality of a public health crisis.
The Genesis of the Data Debate: A Chronology of the Axios Exchange
To understand the controversy surrounding the reporting of pandemic statistics, one must first examine the specific exchange that prompted the surge in fact-checking efforts. On August 3, 2020, Jonathan Swan challenged President Trump on the administration’s narrative that the United States was outperforming the rest of the world in managing the pandemic.
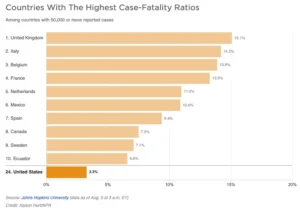
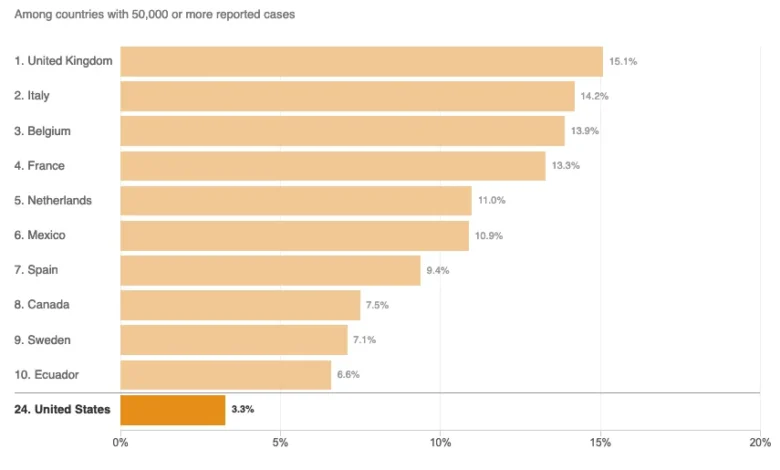
During the interview, the President produced a chart emphasizing the "case fatality ratio" (CFR)—the number of deaths divided by the number of confirmed infections. By highlighting this specific metric, the President argued that the U.S. was performing better than other nations. Swan countered by pivoting to the "deaths per capita" metric, which calculates the mortality burden relative to the total population. The President’s dismissal of this metric—stating, "You can’t do that"—sparked a national debate regarding which statistical lens most accurately reflects the severity of a pandemic. While the CFR is useful for understanding the clinical outcome of known infections, mortality per capita is a standard epidemiological tool for assessing the overall population-level impact of a pathogen.
Statistical Omission and the Curse of the Top 10
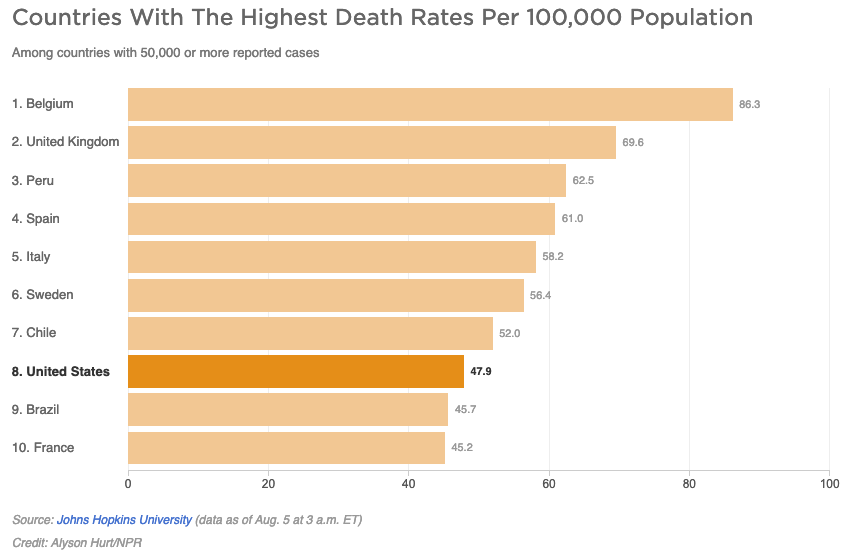
Following the interview, news organizations sought to clarify the situation. On August 5, 2020, NPR published a report titled "Charts: How the U.S. Ranks On COVID-19 Deaths Per Capita — And By Case Count." The report aimed to provide a comparative analysis; however, it utilized truncated datasets that significantly altered the visual narrative.
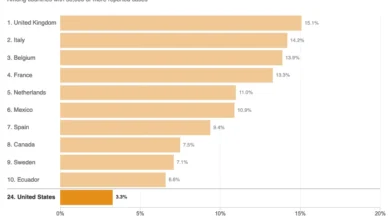
The primary issue with the NPR analysis, and many similar reports during that period, was the arbitrary limit of the data set. By displaying only the top 10 countries with the highest figures, the report suffered from what data scientists call the "curse of the top 10." When examining the 45 countries that had reported 50,000 or more cases by early August 2020, a full-scale analysis reveals a much different picture. By restricting the visualization to a small subset, the charts created a false sense of hierarchy.
When a chart limits itself to the worst-performing nations, the country in the tenth position may appear as though it is in the "middle of the pack," even if it is actually among the worst performers when compared to the global total. Conversely, in the case of the mortality charts provided by NPR, the exclusion of the other 35 countries reporting over 50,000 cases masked the fact that the United States was far from being a global leader in pandemic containment.
Defining Epidemiological Metrics: Disease Burden vs. Proportional Impact
The complexity of pandemic reporting is often exacerbated by the misuse of terminology. In its analysis, the NPR report quoted academic experts who suggested that the per capita death rate was an indicator of "overall disease burden." From a rigorous epidemiological standpoint, this is a problematic simplification.
"Disease burden" is a technical term defined by the World Health Organization (WHO) and other public health bodies as the impact of a health problem in an area measured by financial cost, mortality, morbidity, or other indicators. Specifically, it often involves Disability-Adjusted Life Years (DALYs), which combine years of life lost to premature death and years lived with less than full health.
The per capita death rate is, by definition, a proportional measure—it scales the death toll to the size of the population. It does not account for the total disease burden, which would be more accurately represented by absolute death counts or total infection numbers. When media outlets conflate these terms, they risk providing the public with a flawed understanding of the virus’s impact. The technical definition of disease burden is inherently tied to the total loss of life and quality of life across a population, rather than a ratio that merely adjusts for population density.
The Role of External Factors in Comparative Analysis
The debate over mortality statistics is not merely a numbers game; it is influenced by deep-seated variables that researchers must consider to achieve a fair comparison. These factors include:
- Median Age of the Population: COVID-19 has shown a significantly higher lethality rate in older populations. Countries with a higher median age may naturally show higher per capita death rates than nations with younger demographics.
- Access to Healthcare and ICU Capacity: The ability of a healthcare system to provide mechanical ventilation and intensive care significantly alters the outcome for hospitalized patients.
- Reporting Discrepancies: Not all countries define a "COVID-19 death" in the same way. Some nations only count deaths in hospitals, while others include deaths in nursing homes or suspected cases where no test was performed.
- Testing Infrastructure: The case fatality ratio is heavily dependent on the number of tests performed. A country that conducts widespread testing will naturally identify more mild cases, thereby lowering its CFR, whereas a country with limited testing will only record the most severe, often fatal, cases, leading to a higher CFR.
Because of these variables, an objective news report must not only present the raw numbers but also provide the essential context that explains why those numbers differ. When news outlets present these charts without qualifying the limitations of the underlying data, they facilitate the same misinformation they aim to debunk.
Broader Implications for Journalism and Public Trust
The incident highlights a growing crisis in modern journalism: the difficulty of maintaining objectivity when reporting on highly polarized scientific and political data. When a news organization attempts to be "even-handed" by moderating its critique of political figures, it risks adopting the same faulty metrics that those figures use to obscure the truth.
The failure to present the full data set of 45+ countries was not just a design choice; it was a journalistic error that allowed for a misinterpretation of the severity of the pandemic in the United States. By opting for a clean, simplified graphic rather than a comprehensive, nuanced one, the media inadvertently participated in the polarization of public health data.
As the pandemic progressed, the demand for high-quality, transparent, and context-aware data journalism became increasingly vital. The public relies on these visualizations to form an understanding of the risk to their own lives and the effectiveness of government policy. When data is curated to fit a pre-determined narrative or to simplify complex information for the sake of brevity, it undermines the foundational role of the press.
Ultimately, the goal of reporting on pandemic statistics should be to provide a transparent look at the situation, regardless of whether that data confirms or contradicts the claims of political leaders. By focusing on the "top 10" or other arbitrary groupings, the media fails to provide the objective, total-picture analysis required for the public to hold their leaders accountable. Moving forward, the industry must prioritize statistical literacy and ensure that charts and graphs are representative of the full scope of the available data, rather than curated slices that invite misinterpretation.