The Data Dilemma: How Misleading Visualizations Obscure the Reality of Global COVID-19 Mortality Trends

The COVID-19 pandemic has necessitated an unprecedented reliance on data-driven reporting to navigate the complexities of public health. As governments and international bodies release daily statistics, the role of media organizations in synthesizing this information has become a critical public service. However, the rigor with which these statistics are presented varies, and even established news outlets have faced scrutiny for utilizing data visualizations that may inadvertently—or intentionally—distort the public’s perception of the pandemic’s trajectory. A notable instance of this occurred in August 2020, following an intense public discourse regarding the United States’ handling of the virus compared to the rest of the world.
The Axios Interview and the Catalyst for Debate
The controversy surrounding COVID-19 data reporting intensified on August 3, 2020, following a televised interview between then-President Donald Trump and journalist Jonathan Swan of Axios. During the broadcast on HBO, the discussion shifted toward the federal government’s response to the pandemic. When confronted with evidence that the United States was experiencing significantly higher mortality rates than many other nations, President Trump presented a chart that highlighted the "case fatality ratio"—the number of deaths divided by the number of confirmed infections.
Trump argued that this specific metric demonstrated superior performance by the U.S. when compared to other countries. Swan countered by noting that public health experts generally prioritize deaths per capita—a metric that measures mortality in proportion to the total population—to gauge the actual impact of the virus on a society. The exchange highlighted a fundamental tension in statistical communication: the difference between case fatality rates, which can be heavily influenced by testing capacity and infection identification, and per capita mortality, which provides a clearer view of the total population’s risk exposure.
NPR’s Analysis and the Perils of Arbitrary Data Selection
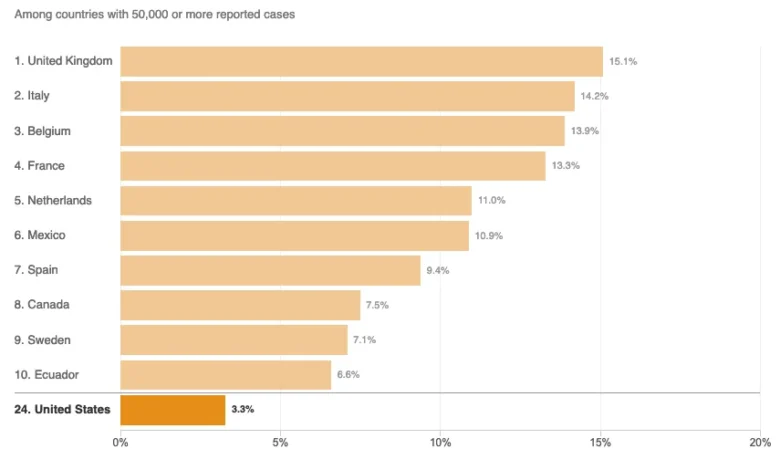
In the days following the interview, National Public Radio (NPR) published an article titled "Charts: How the U.S. Ranks On COVID-19 Deaths Per Capita — And By Case Count." The report aimed to provide context for the Axios interview by visualizing how the U.S. compared to its international peers. However, the methodology used to construct the charts drew immediate criticism from data visualization experts.
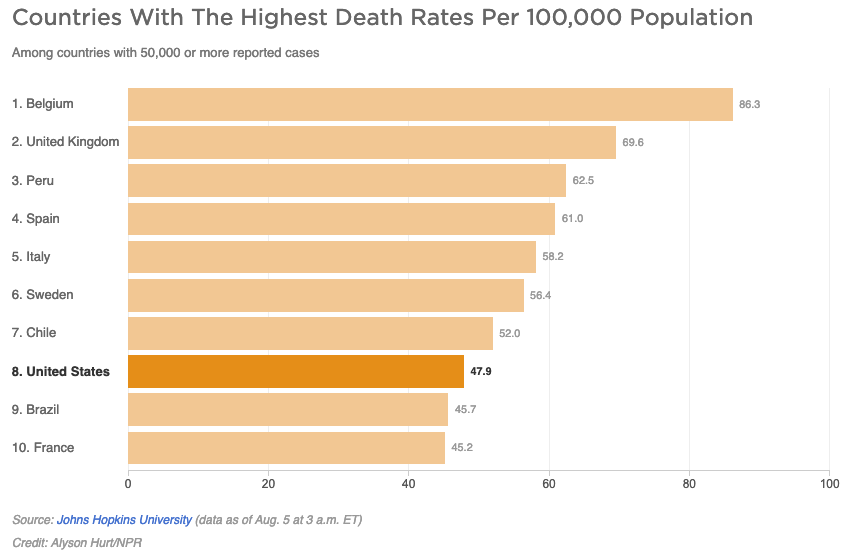
The NPR article featured two primary charts, each comparing the United States to a subset of other nations that had reported at least 50,000 COVID-19 cases. The issue, according to critics, was the decision to limit these charts to the top ten nations. By truncating the list, the visualizations created a distorted narrative. In the chart depicting deaths per capita, the limited sample size suggested that the United States was performing relatively well, trailing only a handful of other countries. In reality, as of August 5, 2020, there were 45 countries with more than 50,000 reported cases. Had the chart included the full dataset, the U.S. would have appeared significantly lower in the rankings, illustrating that the majority of nations with significant outbreaks were experiencing lower per capita death rates.
The Statistical Curse of Truncated Data
The practice of limiting data sets—often referred to as the "curse of the top ten"—is a common pitfall in journalistic data presentation. When a chart is designed to show only a narrow slice of a larger population, it risks cherry-picking data points that support a specific, potentially misleading conclusion.
In the context of the NPR report, the exclusion of nearly 80 percent of the relevant peer group—the other 35 countries that met the 50,000-case threshold—prevented the reader from seeing the full picture of the global pandemic landscape. By arbitrarily stopping at ten, the visualization obscured the fact that the U.S. was not an outlier in terms of success, but rather a nation experiencing a disproportionate burden of mortality. This lack of transparency in data selection serves to undermine the very goal of "data journalism," which is to simplify complex realities without sacrificing accuracy.
Epidemiological Definitions and Misconceptions
The NPR article also included commentary from academic experts, such as Justin Lessler, an associate professor of epidemiology at Johns Hopkins University. The piece stated that the per capita death rate is primarily an indication of the "overall disease burden in a country," further defining disease burden as the impact of a disease in terms of years of life lost and years lived with disability.
Critics have noted that this explanation conflates distinct epidemiological concepts. Per capita death rate is a proportional measure, not an absolute one. The "overall disease burden" is more accurately reflected by total case counts and mortality figures that account for age-adjusted populations. Furthermore, the technical definition of disease burden provided—years of life lost—is a complex metric that cannot be deduced from a simple per capita mortality chart. By blending these definitions, the reporting risked adding confusion to an already polarized public conversation, rather than providing the clarity necessary for informed civic discourse.
Contextualizing Global Mortality
To understand why the U.S. performance remained a point of intense contention, it is necessary to look at the factors that drive international disparities. Public health researchers have identified several variables that make direct country-to-country comparisons difficult, yet vital. These include:
- Median Age: COVID-19 mortality is strongly correlated with age. Countries with older populations, such as Italy or Japan, naturally face higher mortality risks, necessitating age-adjusted data for fair comparisons.
- Testing Capacity: A country that tests more aggressively will capture more mild cases, which mathematically lowers its case fatality ratio. This is why comparing case fatality rates without acknowledging testing volume can be misleading.
- Healthcare Infrastructure: The availability of ventilators, ICU beds, and specialized medical staff plays a direct role in patient outcomes. Variations in healthcare systems mean that a patient with the same symptoms might have a vastly different survival probability in different nations.
- Reporting Standards: Different countries maintain different protocols for attributing deaths to COVID-19. Some nations count only hospital-confirmed deaths, while others include probable deaths occurring in nursing homes or private residences.
Implications for Future Reporting
The incident underscores the growing necessity for media literacy regarding data visualization. In an era where information is consumed in rapid, bite-sized formats, the structure of a chart often leaves a stronger impression than the accompanying text. When news outlets prioritize aesthetic simplicity or narrative convenience over the inclusion of comprehensive datasets, they inadvertently participate in the spread of misinformation.
Professional journalistic standards dictate that charts should be inclusive, clearly labeled, and contextualized. When comparing the United States to other nations, the most responsible approach is to include all relevant nations meeting specific criteria, or to provide a representative sample that is explicitly labeled as such, rather than a top-ten list that implies a comprehensive ranking.
Broader Impact on Public Trust
The ultimate consequence of such reporting lapses is the erosion of public trust in both news media and scientific institutions. When a reputable source like NPR produces visualizations that are perceived as biased or incomplete, it emboldens those who seek to discredit mainstream media as "fake news" or partisan actors.
Conversely, when journalists remain committed to transparency—even when the data is unfavorable to a particular political administration or narrative—they reinforce the vital role of the press as a check on power. The responsibility of the modern newsroom is not merely to report the numbers, but to ensure the methodology behind those numbers is visible and defensible. As the world continues to grapple with the long-term effects of the pandemic and the ongoing challenges of public health communication, the rigor applied to data visualization will remain one of the most important metrics of journalistic integrity. Moving forward, the industry must prioritize methodological transparency to ensure that the public is not just informed, but accurately informed.
Related posts: