Visualizing Global Health Crises: The Challenge of Data Integrity and Clear Communication in the COVID-19 Era

As the COVID-19 pandemic continues to unfold with profound global consequences, data analysts and health organizations are faced with the monumental task of tracking the virus’s trajectory in a way that is both accurate and accessible to the public. The challenge of comparing mortality rates across disparate nations is not merely a statistical hurdle; it is a fundamental issue of data integrity, reporting standards, and the visual communication of complex, rapidly evolving information. While visual representations are essential for decision-makers and the general public, many existing attempts at data visualization have proven confusing, misleading, or overly complex, failing to provide the clarity required to understand a multifaceted international emergency.
The Problem of Data Inconsistency
At the core of the difficulty in mapping the pandemic is the inherent variability in how countries collect and report health data. Comparing mortality rates is fraught with systemic complications that no amount of sophisticated graphic design can fully resolve. Even within the United States, which possesses one of the world’s most advanced healthcare systems, the classification of COVID-19 fatalities has been subject to ambiguity.
For instance, when a patient presents with multiple comorbidities—such as pneumonia or chronic respiratory conditions—and subsequently dies, the designation of the primary cause of death on a certificate often lacks a standardized, universal protocol. Medical personnel, operating under extreme pressure, prioritize immediate life-saving interventions over administrative data entry, leading to discrepancies that vary significantly from one jurisdiction to another. This issue is not unique to the U.S.; it is a universal challenge, as varying testing capabilities, reporting timelines, and definitions of "COVID-19 death" create a fragmented statistical landscape. Consequently, any comparative analysis must be approached with the caveat that these figures represent a baseline of available data rather than an absolute, immutable count of all lives lost.
Chronology of Data Reporting
The timeline of COVID-19 reporting began in late December 2019, when the World Health Organization (WHO) was alerted to a cluster of pneumonia cases in Wuhan, China. By mid-January 2020, the virus had crossed international borders, and by March 2020, the WHO officially declared the outbreak a pandemic.
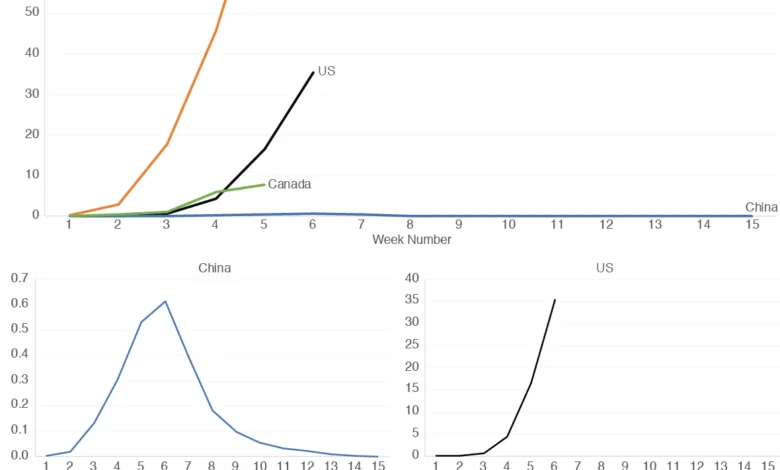
Following the initial global surge, governments scrambled to build reporting infrastructures. During the first quarter of 2020, the focus shifted from identifying cases to managing mortality statistics. However, as the months progressed, it became evident that the sheer volume of cases, combined with different healthcare capacities, led to a wide divergence in mortality metrics. Analysts quickly realized that plotting these figures on a single, linear graph often resulted in visual clutter that masked the true nature of the outbreaks in countries with lower absolute numbers, such as China, when compared to the massive spikes seen in countries like Italy or the U.S.

The Evolution of Data Visualization
Early attempts to visualize this data often relied on complex, multi-layered charts that failed to account for the immense differences in population size and the scale of the outbreaks. A standard line graph, while intuitive, often presents a "scaling problem." When a country with a high death toll per capita is plotted alongside one with a lower toll, the line representing the latter often flattens against the x-axis, rendering its data trends effectively unreadable.
To address this, some analysts turned to logarithmic scales. While useful for professionals accustomed to seeing exponential growth, these scales are notoriously difficult for the general public to interpret, as they compress large values and exaggerate small ones, potentially leading to misinterpretation. The consensus among design experts now leans toward "decomposed" visualization—using a series of smaller, independently scaled graphs. This approach allows the viewer to see the specific patterns of growth, decline, and plateauing for each nation without the distortions caused by comparing vastly different magnitudes on a single, unified axis.
Official Responses and Statistical Challenges
Health authorities, including the Centers for Disease Control and Prevention (CDC) and the European Centre for Disease Prevention and Control (ECDC), have frequently cautioned against using their data for cross-country "rankings." The logic is clear: because countries are in different phases of their respective outbreaks and employ different testing strategies—ranging from widespread asymptomatic testing to only testing the severely ill—a raw comparison is often comparing "apples to oranges."
In response to the public’s demand for information, many platforms have adopted a "per million people" metric to normalize data across different population sizes. However, this, too, has limitations. Without adjusting for age demographics, underlying health status, and population density, the "per million" figure remains an incomplete indicator of the virus’s severity in a specific locale.
Broader Implications of Data Literacy
The reliance on clear, honest data representation has profound implications for public policy and individual behavior. If a graph suggests that mortality in a country is "flattening," it may lead to premature relaxation of social distancing mandates or travel restrictions. Conversely, if a graph is overly alarmist or poorly scaled, it may cause unnecessary panic or a loss of public trust in official sources.
Professional data analysts argue that the most effective way to communicate this information is through transparency regarding the limitations of the data. When a graph is presented, it should ideally be accompanied by context:

- Contextualizing the Data: Are these deaths confirmed or suspected?
- Normalization: Has the data been adjusted for population size?
- Time-Lag Indicators: Does the graph reflect the date of death or the date of reporting, which often suffers from weekend delays?
A Strategy for Clarity: The Small Multiples Approach
The "small multiples" technique, which uses a series of separate, standardized charts, is widely considered the gold standard for comparing national trends. By keeping the x-axis consistent (e.g., "weeks since the first death") and allowing the y-axis to scale to the specific data of each country, observers can compare the "shape" of the curve—the rate of acceleration and deceleration—without being distracted by the absolute number of fatalities.
For example, when comparing Italy and China using this method, the similarities in their initial infection trajectories become apparent. This allows researchers to study whether specific policy interventions in one country might have mirrored the outcomes in another. Similarly, when examining the U.S. and Canada, the small multiples approach highlights subtle differences in the timing of the "peak," allowing for a more granular analysis of how specific regional responses might have impacted the course of the pandemic.
Future Outlook on Health Data
As we move further into the post-pandemic recovery phase, the lessons learned regarding data visualization remain relevant. The COVID-19 pandemic acted as a global stress test for data literacy. It revealed that in an age of information overload, the value of data is not in its volume, but in its presentation.
Moving forward, health organizations are increasingly prioritizing the development of dashboards that are not only real-time but also educational. The goal is to provide the public with the tools to distinguish between noise and signal, ensuring that policy debates are grounded in a shared understanding of the facts. While no graph can ever be a perfect reflection of a complex biological event, the move toward clearer, more accessible, and more intellectually honest data visualization is a critical step in building a more resilient global health communication strategy. By acknowledging the limits of our data and choosing our visual tools with precision, we can better navigate the complexities of future public health challenges.