The Perils of Interpreting Daily COVID-19 Statistics in an Era of Market Volatility

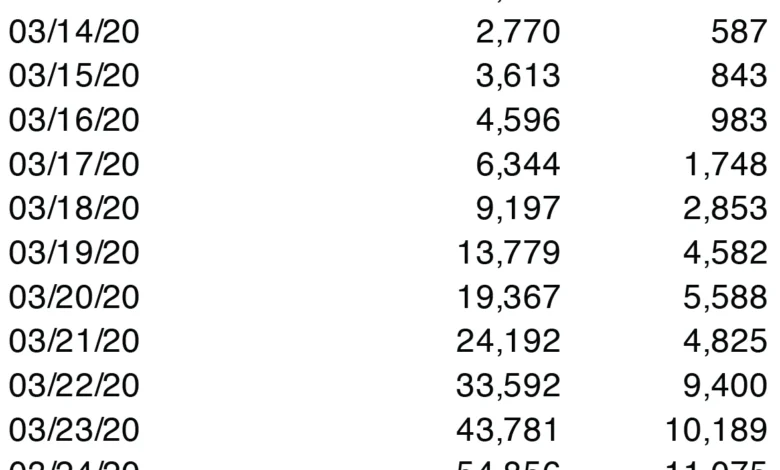
During the early stages of the COVID-19 pandemic in the spring of 2020, the convergence of public health data and financial market behavior created a volatile environment where statistical noise was often misinterpreted as a definitive signal of progress. On April 6, 2020, financial news outlets—most notably Investor’s Business Daily—reported that the Dow Jones Industrial Average had surged by over 1,600 points, or 7.73%. This massive rally was largely attributed to a momentary dip in the daily count of new COVID-19 cases in the United States, which had fallen to 25,316 on April 5th, down from the record 34,196 reported the previous day. This market reaction, while reflective of an investor appetite for positive news, highlighted a fundamental misunderstanding of how pandemic data is collected, aggregated, and reported.
The Illusion of Daily Trends
The reliance on daily fluctuations to determine the trajectory of a global pandemic is inherently flawed due to the nature of epidemiological reporting. Data sets provided by the Centers for Disease Control and Prevention (CDC) and various state health departments are not real-time reflections of infection rates. Instead, they are lagging indicators that reflect when a test was processed, when a result was reported to a local laboratory, and when that data was transmitted to a central database.

When financial analysts and the general public treat these figures as a precise daily "thermometer" for the virus, they ignore the systemic administrative delays. As of early April 2020, the United States was grappling with a massive testing backlog. Many individuals with mild or moderate symptoms were unable to access testing, meaning that official case counts were significantly lower than the actual number of infections. Furthermore, the reporting process involves a multi-step chain of custody—from the point of medical contact to the regional health department, and finally to the federal repository. Disruptions in any of these nodes, such as weekend staffing shortages or technical delays in laboratory reporting, create artificial "dips" in the data that are often mistaken for a decline in disease transmission.
Chronology of Data Reporting: A Case Study
The period between April 3 and April 6, 2020, serves as a quintessential example of how misleading short-term data can be. On April 3rd, the U.S. reported a sharp, alarming spike in new cases. By April 5th, the numbers dropped, prompting headlines suggesting that the pandemic had reached its peak and was finally beginning to retreat.
However, adding just one more day of data—April 6th—revealed that the supposed downward trend was not a reversal of the pandemic’s course, but rather a statistical artifact. When the full week’s data was analyzed, it became clear that the growth rate of infections remained on an upward trajectory. This pattern underscores the necessity of using moving averages to filter out the "noise" of daily reporting. A 5-day moving average, which smooths out the volatility by combining current data with the previous four days, provides a much more stable representation of the virus’s spread. When viewed through this lens, the "peak" of early April vanishes, revealing a more consistent, albeit concerning, rate of increase.

Factors Influencing Statistical Noise
The volatility in reported case counts is driven by several systemic factors. First, the reporting date is not synonymous with the infection date. The incubation period of the virus—often ranging from two to fourteen days—means that a case reported today may have been contracted nearly two weeks ago. By the time a case is officially counted, it is effectively a "historical" statistic rather than a predictive one.
Second, the capacity of the testing infrastructure remains a significant variable. In April 2020, the shortage of testing reagents and personal protective equipment (PPE) meant that many laboratories were overwhelmed. When a backlog of tests is processed at once, it creates a "spike" in the data. Conversely, when staffing is reduced over a weekend, the number of processed tests drops, resulting in an artificial "lull." These administrative realities have little to do with the actual biological spread of the virus in the community.
Economic and Societal Implications
The tendency to conflate daily medical statistics with economic health has profound implications. In the spring of 2020, the "reopening" narrative was heavily dependent on the assumption that the virus was contained. When investors, policymakers, and the public base critical decisions on flawed, short-term data, the risk of "false starts" increases.

A market rally fueled by a misunderstanding of public health data can lead to premature economic reopening, which in turn can exacerbate the spread of the virus. If the public perceives that the "curve has flattened" because of a two-day decline in reported cases, social distancing compliance may wane. This cycle of premature optimism followed by a subsequent surge in cases not only prolongs the duration of the pandemic but also inflicts further damage on long-term economic stability.
The Importance of Statistical Literacy
As we navigate complex crises, the importance of statistical literacy cannot be overstated. Public health experts have consistently argued that the trajectory of a pandemic can only be accurately assessed in retrospect. Models are essential, but they are educated guesses based on the data available at the time, which is frequently incomplete.
Official responses from health agencies like the CDC have frequently cautioned against focusing on any single day’s data. Instead, they emphasize long-term trends and metrics such as hospital capacity, the percentage of positive tests, and the effective reproduction number ($R_e$). These metrics, while less "punchy" for a headline or a stock market ticker, provide a much more accurate picture of the situation on the ground.

Conclusion: Patience as a Strategy
The desire for a swift resolution to the COVID-19 pandemic is understandable, but that desire should not supersede the need for objective analysis. The events of early April 2020 provide a cautionary tale about the dangers of "data myopia." By prioritizing the long-term trend over the daily headline, both the financial sector and the general public can avoid the pitfalls of reactive decision-making.
As the pandemic evolves, the challenge of maintaining accurate data reporting will likely persist. As medical professionals become increasingly overtaxed, the potential for reporting errors and delays will naturally rise. Consequently, the reliance on smoothed data sets, such as moving averages, will remain the most reliable method for monitoring the pandemic’s progress. True understanding of such a complex event requires the discipline to look beyond the immediate noise, favoring patience and a commitment to evidence-based analysis over the temptation of premature, market-driven conclusions. Only through this measured approach can society successfully navigate the uncertainties of a global health crisis.