Visualizing a Global Crisis: Best Practices for Communicating COVID-19 Mortality Data

The rapid emergence of the SARS-CoV-2 virus in early 2020 presented an unprecedented challenge not only to public health systems and government policy but also to the field of data science. As the virus spread across international borders, the global community turned to data analysts to provide clarity on mortality rates, infection patterns, and the efficacy of containment measures. However, the task of synthesizing complex, disparate, and often unreliable datasets into accessible visual formats has proven to be a significant hurdle. When mortality data is presented through overly complex or poorly scaled visualizations, the result is often confusion rather than enlightenment, even among professional statisticians.
The Challenge of Data Integrity and Cross-Border Comparison
At the heart of the crisis in data visualization lies a fundamental issue: the inconsistent reporting of COVID-19 mortality across jurisdictions. Comparing the lethality of the virus between countries is inherently fraught with systemic limitations. Discrepancies arise from variations in testing capacity, differences in death certificate coding procedures, and the burden placed on medical facilities.
In the United States, for instance, the classification of a death as COVID-19-related often depends on the presence of comorbidities. If a patient suffering from chronic pneumonia dies while also testing positive for SARS-CoV-2, reporting standards have historically lacked the uniformity required for precise global aggregation. Similar complexities exist worldwide; in many regions, the priority of healthcare workers is rightfully shifted toward life-saving clinical interventions rather than the granular documentation of epidemiological data. Consequently, analysts must acknowledge that any comparative model is a reflection of available, albeit imperfect, data. Despite these limitations, the imperative to provide accurate, readable, and actionable information remains essential for informed public discourse and policy adjustment.
A Chronology of Data Reporting Hurdles
The initial months of 2020 served as a testing ground for epidemiological reporting. In January, the focus was primarily on localized clusters in Wuhan, China. By February, the focus expanded to include massive outbreaks in Northern Italy. By March, the World Health Organization (WHO) declared a global pandemic, prompting a surge in demand for real-time visualization.

- January 2020: Initial reporting from China established the baseline for mortality modeling. However, the sheer size of the population and the centralized nature of provincial reporting created significant outliers when compared to smaller European nations.
- February 2020: Italy’s rapid surge in mortality necessitated a shift in how Western nations viewed the threat. The data began to show exponential growth patterns, challenging public health infrastructures that were unprepared for the velocity of transmission.
- March 2020: The U.S. and Canada began to report significant numbers, leading to a scramble for uniform reporting metrics. During this period, many early visualizations suffered from "scaling bias," where nations with high mortality rates overshadowed smaller or early-stage outbreaks, rendering the latter invisible on global charts.
The Pitfalls of Complex Visualizations
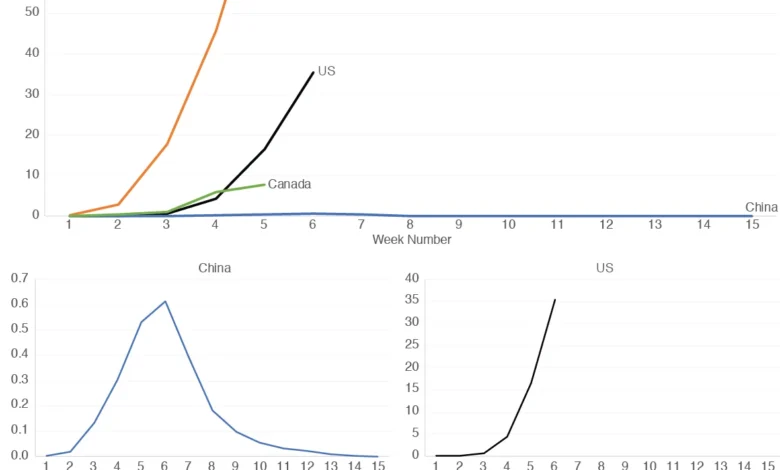
Many early attempts to visualize this data relied on multi-line charts that attempted to aggregate vastly different mortality magnitudes on a single axis. While these charts are technically comprehensive, they often fail the "accessibility test." When a country with a high mortality rate—such as Italy in early 2020—is plotted alongside a country with a significantly lower rate—such as China—the resulting line for the latter often appears as a flat, near-zero horizontal line.
This visual artifact is misleading. It suggests that the mortality rate in the lower-magnitude country is negligible, when in reality, it may simply be a function of population scale or a difference in the timeline of the outbreak. Furthermore, the use of logarithmic scales—while mathematically sound for tracking exponential growth—is often alienating to the general public. Research into data literacy suggests that lay audiences are far more likely to misinterpret logarithmic axes, potentially leading to a misunderstanding of the actual risk levels.
Implementing Improved Design Standards
To address these limitations, data journalists and statisticians have moved toward a "modular visualization" approach. This involves three critical design choices:
- Normalized Metrics: Rather than using raw death counts, data must be normalized by population (e.g., deaths per 1 million people) to allow for an "apples-to-apples" comparison.
- Contextual Scaling: Recognizing that one size does not fit all, experts recommend complementing an aggregate view with individual, independently scaled graphs for each country.
- Temporal Synchronization: Aligning the "start date" of the outbreak for each country allows analysts to observe whether a nation is following a trajectory similar to those that experienced the virus earlier.
By utilizing individual plots for the U.S., China, Italy, and Canada, for example, analysts can reveal nuances that are otherwise lost. A shared-scale graph might show the U.S. and Canada as relatively low-impact compared to the European peak, but individual graphs reveal that Canada’s growth rate actually began to stabilize or decline at a different point in its timeline than the U.S. curve.
Official Responses and Institutional Guidance
Global health institutions, including the WHO and the Centers for Disease Control and Prevention (CDC), have continuously updated their guidance on data reporting to improve transparency. The CDC’s National Center for Health Statistics (NCHS) has, since the onset of the pandemic, worked to refine the death certificate coding process to ensure that COVID-19 as an underlying cause is more accurately captured.

In response to the visualization crisis, academic organizations like the Royal Statistical Society have emphasized the "responsibility of the analyst." Their guidance suggests that data producers have an ethical obligation to ensure that the visual presentation of data does not inadvertently bias the viewer’s perception of risk. They argue that transparency regarding data limitations—such as noting the lack of universal testing or the lag in reporting—must be included as metadata alongside any chart or infographic.
Broader Implications for Public Health Communication
The lessons learned from the COVID-19 data crisis extend well beyond the current pandemic. They underscore a fundamental shift in how the public interacts with institutional data. In an era of "information overload," the ability to present scientific findings in an accessible manner is as important as the scientific research itself.
The economic and social implications of these visualizations are immense. Government leaders often use these data points to justify lockdowns, social distancing mandates, and the reallocation of economic resources. If the visualization of the data is flawed, the perception of public health reality is distorted, which in turn can lead to policies that are either overly restrictive or dangerously permissive.
Furthermore, the "China-Italy comparison" serves as a case study for future epidemiological planning. Observing that the mortality trajectories in these two vastly different nations shared early similarities suggests that the "shape" of the virus’s impact may be more predictable than its "magnitude." By focusing on the patterns of change—the velocity at which deaths rise and the inflection points at which they begin to stabilize—analysts can better forecast the duration of a crisis, even if the absolute number of fatalities remains subject to reporting variances.
Ultimately, the goal of data visualization in a public health crisis is not to create a single, definitive map of the world, but to provide a toolkit for understanding. By combining normalized aggregate data with granular, independently scaled country views, we move closer to a visual language that respects both the complexity of the science and the intelligence of the public. As data streams continue to evolve, the emphasis must remain on clarity, reproducibility, and a humble acknowledgment of the gaps in our current understanding. This approach ensures that while the virus may be unpredictable, our method of tracking its progress remains firm, transparent, and grounded in the best available evidence.