The Ethics of Data Visualization: Evaluating NPR’s COVID-19 Reporting in the Context of Political Discourse

In the midst of the global COVID-19 pandemic, the dissemination of accurate, nuanced, and context-rich data has become a cornerstone of public health communication. As nations grapple with the virus, the metrics used to track mortality—such as deaths per capita and case fatality ratios—have transitioned from niche epidemiological tools into central elements of political debate. The precision with which media outlets present these figures directly impacts public understanding and the ability of citizens to assess governmental performance. However, recent scrutiny of an August 2020 NPR report regarding COVID-19 mortality rankings suggests that even established news organizations can inadvertently produce misleading narratives through the selective omission of data and the application of arbitrary formatting constraints.
The Genesis of the Data Conflict
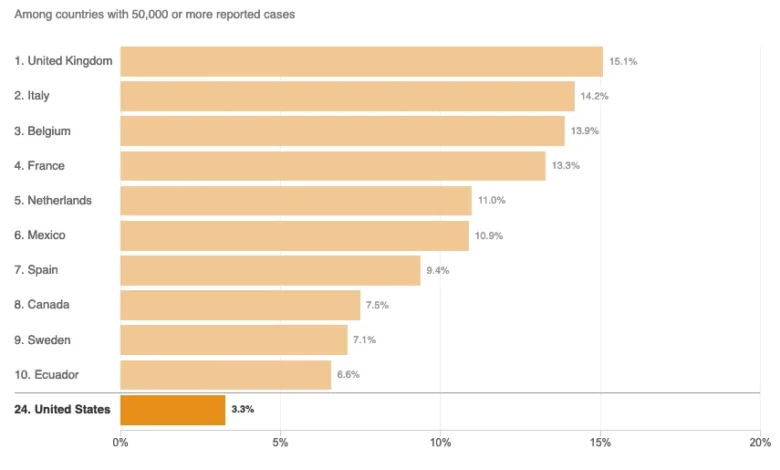
The scrutiny surrounding COVID-19 reporting reached a fever pitch following an interview between President Donald Trump and Axios journalist Jonathan Swan, which aired on HBO on August 3, 2020. During the exchange, the President asserted that the United States was performing better than any other nation regarding COVID-19 mortality. When presented with counter-evidence by Swan, the President cited a chart focused on the "case fatality ratio"—the proportion of deaths among those who have tested positive for the virus.
The President’s argument drew a sharp distinction between absolute death counts and relative mortality rates. When Swan redirected the conversation to deaths per capita—a metric that accounts for population size and is widely considered by public health officials to be a more accurate reflection of a country’s disease burden—the President dismissed the methodology as invalid. This confrontation highlighted the fundamental tension between different statistical lenses: while case fatality ratios can reflect the effectiveness of healthcare systems in treating infected individuals, per capita death rates offer a clearer view of how effectively a country is suppressing the spread of the virus among its general population.
NPR’s Graphical Analysis and the “Curse of the Top 10”
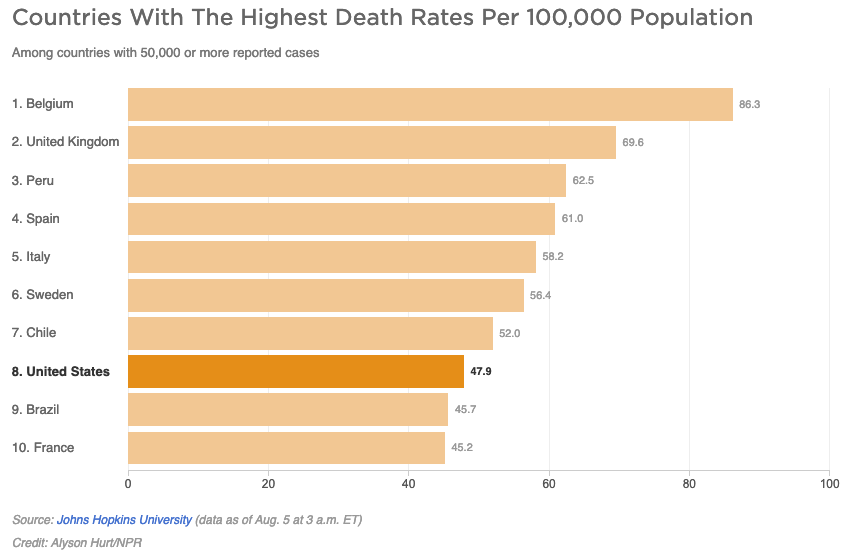
Following the Axios interview, NPR published an article titled Charts: How the U.S. Ranks On COVID-19 Deaths Per Capita — And By Case Count on August 5, 2020. While the article aimed to provide objective context to the presidential interview, critics noted that the visual presentation of the data relied on limited datasets that skewed the perception of the United States’ standing.
The article featured two primary charts, each comparing the United States against other nations that had reported at least 50,000 COVID-19 cases. The fatal flaw identified by data visualization experts was the decision to cap these charts at the "top 10" countries. By limiting the scope, the charts omitted the majority of relevant data points. As of August 5, 2020, there were 45 countries with over 50,000 reported cases. By displaying only the top 10, the chart created a false impression of the U.S. position. In the per capita death chart, for instance, the visual exclusion of the other 35 qualifying countries suggested that the U.S. was performing better than the vast majority of nations, when in fact, the U.S. was performing worse than 37 of the 44 other countries with similar case burdens.
This phenomenon, often referred to as the "curse of the top 10," demonstrates how arbitrary truncation can transform a data-driven report into a misleading visual narrative. When a sample size is filtered without a rigorous justification, the resulting graphic ceases to be a comprehensive overview and instead becomes a curated snapshot that can inadvertently support or undermine specific political claims.
Epidemiological Definitions and the Complexity of “Disease Burden”
The NPR report further complicated the discourse by citing Justin Lessler, an associate professor of epidemiology at Johns Hopkins University, to define the significance of per capita death rates. The article stated that the per capita death rate is primarily an indication of the "overall disease burden" in a country, subsequently defining disease burden as "the impact of a particular disease in terms of years of life lost and years lived with disability."
Data analysts have pointed out two significant inaccuracies in this presentation. First, per capita death rates reflect proportional burden, not the overall volume of the disease’s impact, which is more accurately captured by total case counts and total death tolls. Second, the technical definition provided for "disease burden"—years of life lost—cannot be derived solely from a per capita death rate. This conflation of terms, while perhaps intended to simplify complex concepts for a lay audience, risked muddying the waters of public understanding. The distinction between a health metric that measures intensity (per capita) and one that measures total scope (absolute count) is vital for policymakers and the public alike.
Comparative Metrics: The Role of Demographics and Infrastructure
Beyond the graphical presentation, the scientific community emphasizes that mortality comparisons between nations are inherently fraught with variables that raw data cannot fully capture. Factors such as the median age of a population, the strength of the national healthcare infrastructure, and the timing of initial public health interventions play critical roles in determining mortality outcomes.
For example, countries with an older demographic profile are statistically more susceptible to higher COVID-19 mortality rates, as age is the most significant risk factor for severe outcomes. Similarly, a nation’s access to ICU capacity, ventilators, and PPE (Personal Protective Equipment) can dramatically alter the case fatality ratio, regardless of the virus’s prevalence. By failing to include these broader contextual factors, simplified charts—even those produced by reputable sources—often miss the "why" behind the numbers, leaving the audience with a surface-level interpretation that may be easily manipulated by political actors.
The Responsibility of Media in the Data Age
The implications of this reporting style extend far beyond the immediate news cycle. In an era of digital misinformation, the media serves as the primary filter for public health data. When a news outlet—especially one with the reputation of NPR—presents data in a way that ignores the broader set of relevant nations, it risks losing the trust of the public.
The objective of journalism in a crisis should be to empower the audience with the full picture. Transparency in methodology is key: if a chart is limited to 10 countries due to space constraints, the label must explicitly state that it is not a comprehensive ranking. Furthermore, providing a link to the full, unfiltered dataset would allow readers to verify the findings independently.
Broader Implications for Public Discourse
The interaction between the Trump administration’s rhetoric and the media’s subsequent reporting highlights a systemic challenge. Political figures have a vested interest in selecting the specific metrics that portray their administration in the most favorable light. The role of the media, therefore, is not to act as a neutral arbiter that splits the difference, but as an investigator that provides the full, objective context to prevent such cherry-picking from distorting the truth.
By attempting to appear "even-handed," news outlets may inadvertently grant legitimacy to claims that are factually hollow. When the U.S. was, by nearly every metric, struggling to contain the virus compared to other industrialized nations, a chart that visually placed the U.S. in the "middle of the pack" or better provided an unintended lifeline to the administration’s misleading narrative.
Ultimately, the lesson from this episode is that data visualization is not a neutral act. Every choice—from the selection of countries to the scale of the axes—carries a narrative weight. As the world continues to face complex global challenges, the standard for data journalism must be set higher. Accuracy in reporting requires not just the correct numbers, but the correct scope, the correct context, and the refusal to simplify data at the expense of truth. The media’s role remains to inform the public with the highest degree of precision, ensuring that the complexity of the pandemic is reflected in the clarity of the reporting. Moving forward, a more rigorous approach to data visualization will be essential to maintaining the integrity of public discourse and ensuring that society can make informed decisions based on the totality of available evidence.