The Macroeconomic Context and Digital Acceleration
The onset of the global pandemic in early 2020 acted as a catalyst for a decade’s worth of digital transformation within a matter of months. According to data from the U.S. Census Bureau, e-commerce penetration saw a surge that outpaced projections, with consumers rapidly migrating toward online platforms for essentials, services, and entertainment. This shift was not merely temporary; it established new baseline expectations for how customers interact with brands. Businesses that relied heavily on brick-and-mortar storefronts faced immediate disruptions, while those with established digital footprints struggled to calibrate their advertising spend against erratic traffic patterns.
In this climate, traditional marketing models—which often relied on historical data—became unreliable. The "customer journey" became fragmented, with users oscillating between mobile searches, social media discovery, and direct app engagement. Consequently, the ability to measure the efficacy of every touchpoint became the primary concern for Chief Marketing Officers and small business owners alike.
Optimizing Attribution in a Fragmented Market
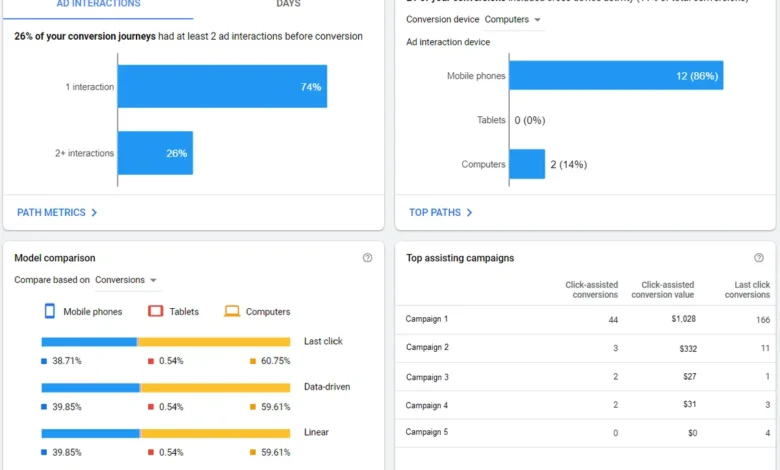
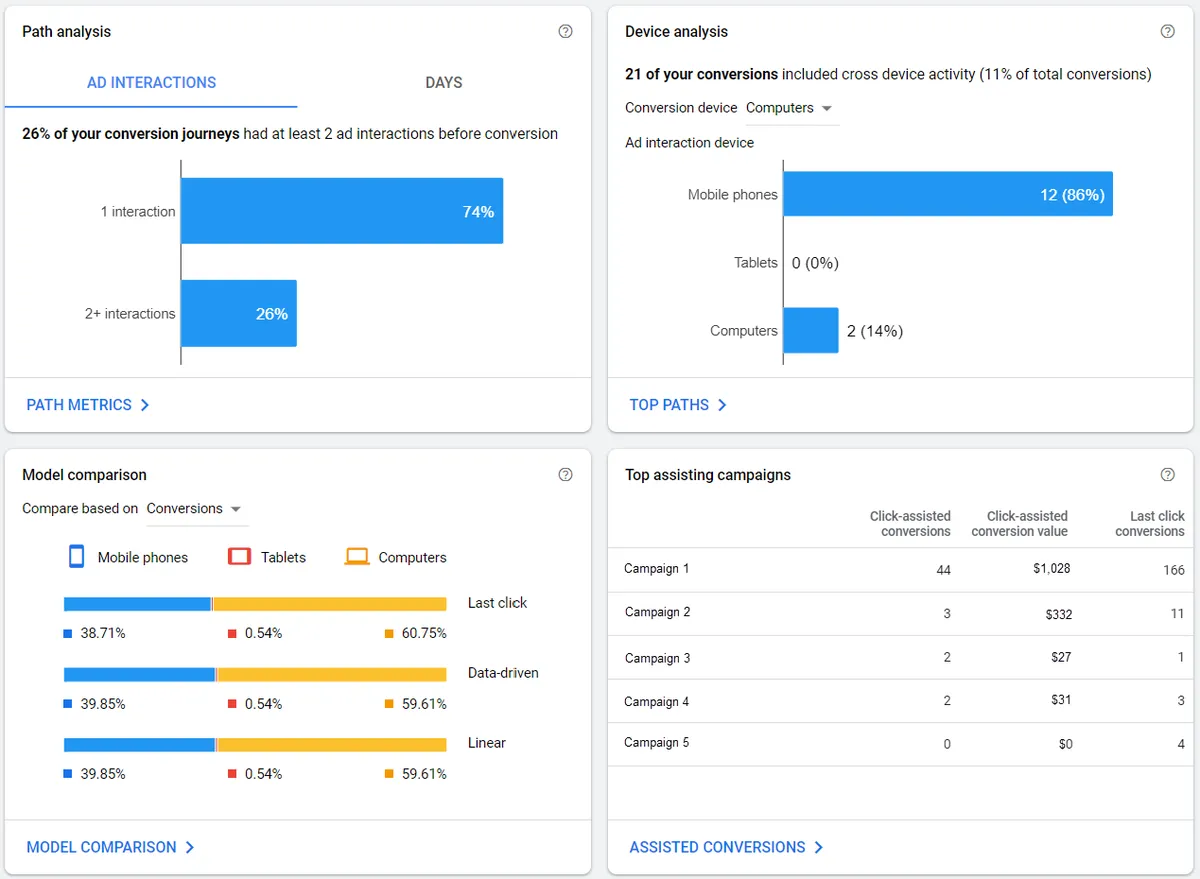
The primary challenge for any marketing campaign is understanding which specific interventions drive conversions. Attribution in Google Ads serves as the foundational mechanism for this analysis. It allows businesses to move beyond a simple "last-click" analysis, which often obscures the nuanced role of top-of-funnel engagement. By awarding credit to various interactions—clicks, impressions, and assisted conversions—companies can better understand the multi-layered path to purchase.

Google’s recent overhaul of its attribution reporting interface reflects a broader industry move toward intuitive, visual data synthesis. By simplifying how these reports are displayed, the platform enables marketing teams to identify high-performing segments without requiring deep data science expertise. This accessibility is critical for small-to-medium enterprises (SMEs) that must maximize every dollar of their budget.
Data-driven attribution models, powered by machine learning, represent the pinnacle of this shift. Unlike rules-based models, which assign static weights to touchpoints, machine learning algorithms analyze historical account data to determine the actual incremental contribution of each interaction. In practical terms, for a business such as a grocery chain, this might reveal that mobile ad clicks are significantly more influential in triggering a purchase than previously assumed. By reallocating budget toward these high-impact channels, businesses can mitigate the waste that typically accompanies static budgeting.
Chronology of Data-Led Decision Making
The deployment of these analytical tools follows a structured approach to crisis management:
- Baseline Stabilization (Phase 1): Businesses utilize Google Analytics to establish a new normal. By tracking weekly conversion rates and user behavior on websites and apps over a 60-day window, companies identify where the friction lies in their digital sales funnels.
- Trend Visualization (Phase 2): Utilizing Google Data Studio, stakeholders create dynamic dashboards that aggregate data from multiple sources, such as Google Ads and organic search, to visualize the rate of change in customer demand.
- Adaptive Implementation (Phase 3): Using tools like Google Optimize, businesses act on their insights. Whether it is deploying a banner to announce updated health and safety protocols or reallocating budget to high-performing campaigns, this phase focuses on rapid iteration.
The Role of Analytics in Operational Continuity
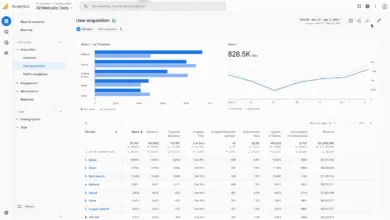
Measurement is only as valuable as the action it informs. For many firms, the primary obstacle is the time required to manually analyze reports. To address this, Google has introduced "reporting shortcuts" within Analytics, allowing users to bypass complex custom reporting setups. For instance, a retailer can monitor weekly conversion trends over the last two months with a single click, providing a macro view of performance that can trigger inventory adjustments or staffing shifts.

This level of granular insight is vital when business conditions change overnight. During periods of economic contraction, the margin for error in advertising spend is razor-thin. Analytics provide the evidence-based justification for maintaining, pausing, or scaling specific campaigns.
Visualizing Strategy with Data Studio
Data visualization serves as the bridge between technical data and executive decision-making. Google Data Studio allows non-technical team members to interact with complex datasets through curated templates. These templates are designed for specific outcomes, such as monitoring daily online sales or tracking the ROI of specific ad campaigns.
The implication here is one of organizational agility. When a marketing team can visualize the performance of a campaign in real-time, they are no longer waiting for end-of-month reports to realize that a strategy is failing. Instead, they can reallocate resources to channels that are currently yielding the highest return on ad spend (ROAS). This capability is particularly vital in the context of fluctuating supply chains and unpredictable consumer sentiment.
Agile Website Management
The digital storefront has become the primary point of contact for most customers. During periods of disruption, such as changing store hours or altered shipping policies, the website must act as the source of truth. Google Optimize provides a low-barrier-to-entry solution for this. By allowing businesses to deploy banners or modify site elements without heavy IT intervention, it keeps the communication channel between brand and consumer fluid.
Furthermore, the extension of features such as "site personalization"—whereby businesses can customize the user experience for different audience segments—allows for a more empathetic digital interaction. For instance, a brand could provide specific messaging to local customers affected by regional lockdowns while maintaining standard operations elsewhere. The removal of usage restrictions for these tools underscores the necessity for companies to remain flexible during periods of social and economic volatility.
Broader Implications and Strategic Outlook
The shift toward free, accessible, and sophisticated measurement tools signals a maturation of the digital economy. As barriers to entry for high-level data analysis are lowered, the baseline expectation for business performance rises. Companies that ignore these analytical capabilities risk being outmaneuvered by competitors who can identify and capitalize on shifting customer behaviors in real-time.
However, the proliferation of data brings its own challenges. The focus must remain on "actionable" metrics rather than "vanity" metrics. A business may have thousands of visitors, but if those visits do not convert to sales or meaningful engagement, the data is useless. The strategic imperative for the coming years will be the integration of these analytical tools into the core of the business’s decision-making process.
In conclusion, the combination of attribution modeling, real-time analytics, and rapid site optimization represents a robust toolkit for modern business navigation. By leveraging these technologies, organizations can move from a state of reactive uncertainty to one of proactive, data-informed resilience. The future of commerce belongs to those who do not just collect data, but who understand the narrative it tells and have the operational agility to act upon it. As the market continues to evolve, these tools remain the essential compass for navigating the complexities of the modern customer journey.