The Critical Importance of Statistical Transparency and Data Integrity in Reporting Global Pandemic Mortality Rates

The COVID-19 pandemic has fundamentally transformed the global landscape, necessitating a heightened standard for how news organizations process, visualize, and disseminate complex epidemiological data. As nations navigate the shifting variables of infection rates, hospital capacity, and mortality, the responsibility of media outlets to provide clear, accurate, and context-rich information has never been more vital. Recent public discourse, centered on a high-profile interview between former President Donald Trump and journalist Jonathan Swan, has highlighted the profound challenges inherent in communicating health statistics to a public audience, revealing how even established, reputable news outlets can inadvertently contribute to confusion through the selective presentation of data.
The Axios Interview and the Catalyst for Debate
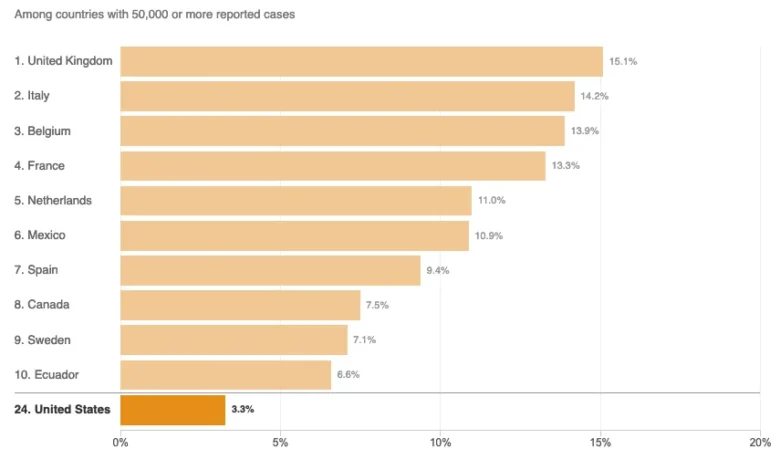
On August 3, 2020, an interview aired on HBO featuring Donald Trump and Axios journalist Jonathan Swan. The exchange became a focal point for the national conversation regarding the administration’s handling of the pandemic. During the discussion, President Trump asserted that the United States was performing better than any other country in managing COVID-19 mortality. When presented with the reality of high death counts, the president attempted to shift the framework of the conversation toward the “case fatality ratio”—the percentage of confirmed cases that result in death.
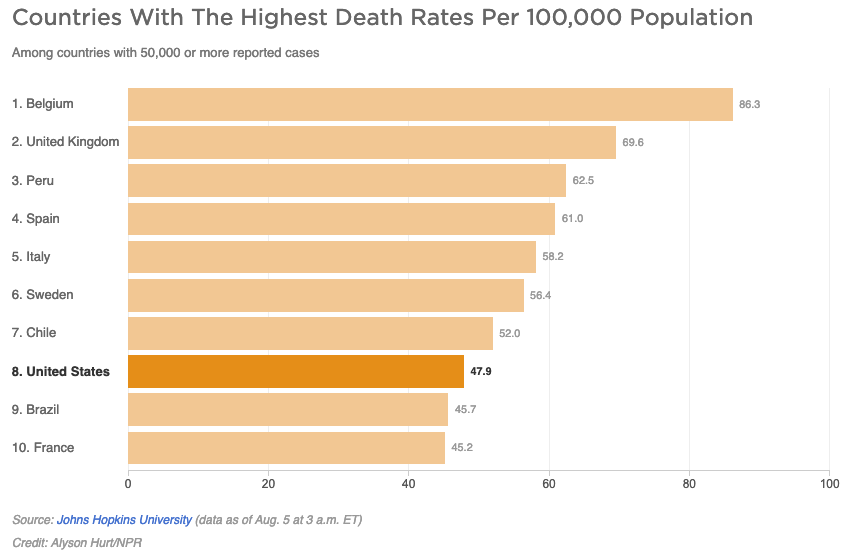
Swan countered by introducing the metric of per capita deaths—the number of deaths relative to the total population—which serves as a standard measure for comparing the health burden across different nations. The president’s dismissal of this metric, famously stating, “You can’t do that,” sparked an immediate debate among data scientists, epidemiologists, and journalists regarding which metrics offer the most accurate reflection of a nation’s pandemic response.
The Role of Data Visualization in Public Understanding
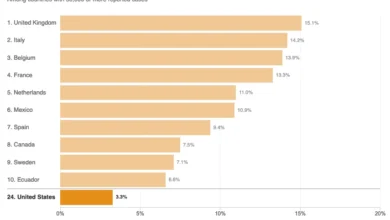
In the aftermath of the interview, National Public Radio (NPR) published a report titled "Charts: How the U.S. Ranks On COVID-19 Deaths Per Capita — And By Case Count." The article sought to provide clarity by visualizing the data points raised during the Axios interview. However, the report became a case study in the risks associated with data truncation and the "curse of the top 10" in graphical representation.
By limiting the charts to the top 10 countries with 50,000 or more reported cases, the visualization inadvertently skewed the perception of the United States’ relative standing. At the time of the publication on August 5, 2020, there were 45 nations that had surpassed the 50,000-case threshold. By displaying only a fraction of this cohort, the charts failed to capture the breadth of the global situation. When the data is truncated in this manner, it risks providing a misleading "snapshot" that can be interpreted to support vastly different political narratives. If a chart only displays the most extreme outliers, the nuances of the middle-of-the-pack performance are lost, potentially leading to false conclusions about a nation’s relative success or failure.
Statistical Literacy and Metric Interpretation
The controversy surrounding the NPR charts highlights the technical complexities of epidemiology. Experts note that both "deaths per capita" and "case fatality ratios" provide distinct, necessary insights, but neither is a standalone indicator of success.
The per capita death rate is widely considered a key measure of a country’s overall disease burden, reflecting how effectively a population is protected from mortality risks. Conversely, the case fatality ratio (CFR) can be heavily influenced by testing capacity; countries with more aggressive testing programs may identify more mild cases, which naturally lowers the CFR. Conversely, countries that only test the most severely ill patients will show a higher CFR.
Furthermore, demographic factors play an outsized role in these statistics. COVID-19 disproportionately affects older populations. Consequently, countries with a higher median age, such as those in Western Europe or Japan, may exhibit higher per capita death rates compared to nations with younger populations, regardless of the quality of their healthcare infrastructure or public health policies. Misunderstanding these nuances—or failing to explain them clearly in reporting—often results in the public consuming information that is technically accurate in its raw form but deceptive in its presentation.
Institutional Challenges in Media Reporting
The journalistic challenge lies in balancing accessibility with precision. When news outlets attempt to provide "even-handed" reporting, there is an inherent danger in creating a false equivalence. By attempting to validate elements of political arguments that are fundamentally unsupported by broader data sets, media organizations may inadvertently provide a platform for misinformation.
In the case of the August 2020 NPR article, the inclusion of technical definitions regarding "disease burden" was criticized by data analysts for being imprecise. Specifically, defining disease burden solely through the lens of per capita deaths ignores the multi-dimensional nature of the term, which typically incorporates years of life lost and years lived with disability. When scientific terminology is used as a shorthand without proper context, the bridge between expert knowledge and public understanding begins to erode.
Broader Implications for Health Journalism
The reliance on clear, comprehensive data is not merely an academic concern; it is a matter of public health. Throughout the pandemic, the public relied on news outlets to contextualize the severity of the virus. When reports are perceived as biased or incomplete, it can lead to a decline in public trust, which in turn impacts adherence to public health guidelines such as social distancing, mask-wearing, and vaccination efforts.
The evolution of modern journalism requires a shift toward higher levels of statistical literacy in newsrooms. Reporters and data editors are increasingly tasked with:
- Contextualizing Data: Ensuring that raw numbers are always accompanied by the variables that influence them, such as population density, testing rates, and age demographics.
- Avoiding Arbitrary Cutoffs: Moving away from "top 10" lists in favor of comprehensive charts that show the full range of available data, or providing clear explanations as to why specific cohorts were chosen.
- Correcting Narrative Frames: Refusing to allow political actors to dictate the framing of scientific data when that framing is demonstrably misleading.
Conclusion: The Path Toward Data Transparency
As the global community continues to grapple with the aftermath of COVID-19 and prepares for future public health challenges, the lessons from the 2020 media cycle remain pertinent. The goal of journalistic reporting on health crises should not be to validate political narratives but to illuminate the reality of the situation through rigorous, transparent data presentation.
The incident involving the NPR report serves as a reminder that even the most trusted news sources must remain vigilant against the pitfalls of simplified data visualization. Accuracy in journalism is not just about the truthfulness of the individual numbers; it is about the honesty of the narrative they are used to build. Moving forward, the integration of data science principles into editorial standards will be essential for ensuring that the public is not just informed, but correctly informed, in an era of information saturation. By prioritizing transparency, context, and statistical integrity, news organizations can fulfill their critical role as the gatekeepers of truth in the modern age, ensuring that the lessons learned from the pandemic are based on a firm foundation of empirical evidence rather than fragmented, selective, or misinterpreted metrics.