The Evolution of Data Integration in Business Intelligence
Data Studio, now widely recognized as a cornerstone of the Google Marketing Platform, was designed to democratize data access. Historically, analysts spent a disproportionate amount of time performing "data janitorial work"—manually exporting CSVs from various sources, cleaning them in spreadsheets, and re-uploading them into reporting tools. With the addition of over 300 data connectors, the platform has shifted from a simple visualization tool to a robust hub for business intelligence.
The integration of Google Surveys and GA4 follows a long-term strategy of unifying Google’s suite of marketing products. Before this update, accessing consumer sentiment data alongside behavioral web data required custom API builds or third-party middleware, which often acted as a barrier for small-to-medium-sized businesses (SMBs) lacking dedicated data engineering teams.
Chronology of Data Studio Advancements
To understand the significance of this update, one must look at the trajectory of the platform:

- 2016: Google introduces Data Studio 360, bringing professional-grade reporting to the Google Analytics suite.
- 2018: The platform transitions to a free-to-use model, drastically increasing its adoption rate among digital marketers.
- 2020: Google announces the major integration of Google Surveys and GA4, signaling the company’s shift toward a "privacy-first" measurement standard.
- Post-2020: The platform continues to evolve toward Looker Studio, incorporating deeper machine learning capabilities and enterprise-level governance.
The 2020 update was particularly critical because it aligned with the industry-wide transition away from Universal Analytics. By allowing GA4 to be a native source, Google encouraged users to migrate to the new event-based tracking model, which offers a more flexible data structure than the session-based tracking of its predecessor.
Google Surveys: Bringing Sentiment into the Dashboard
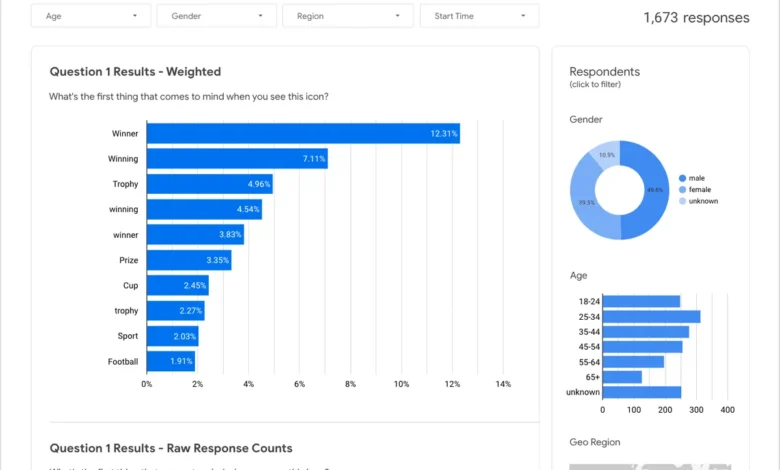
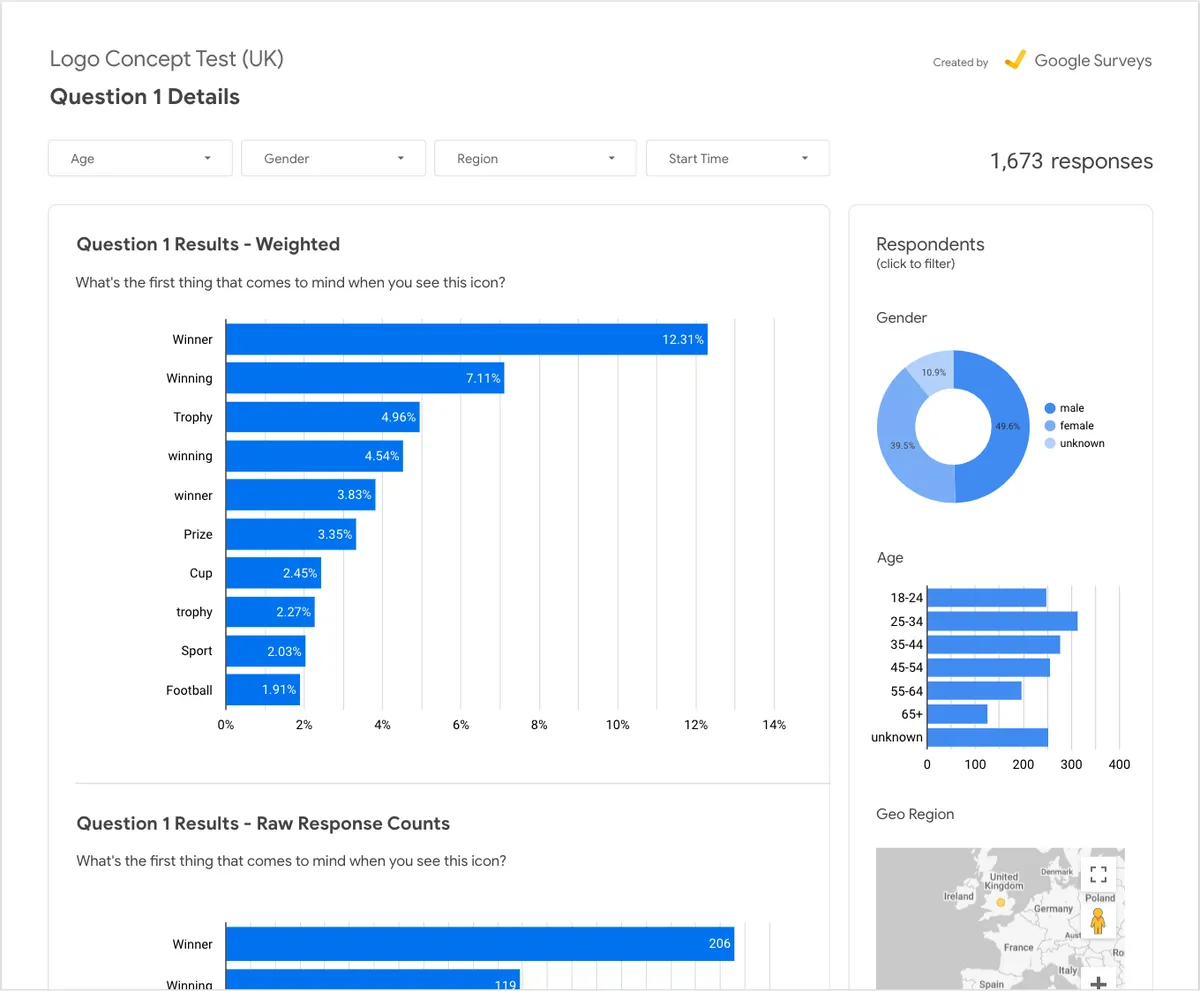
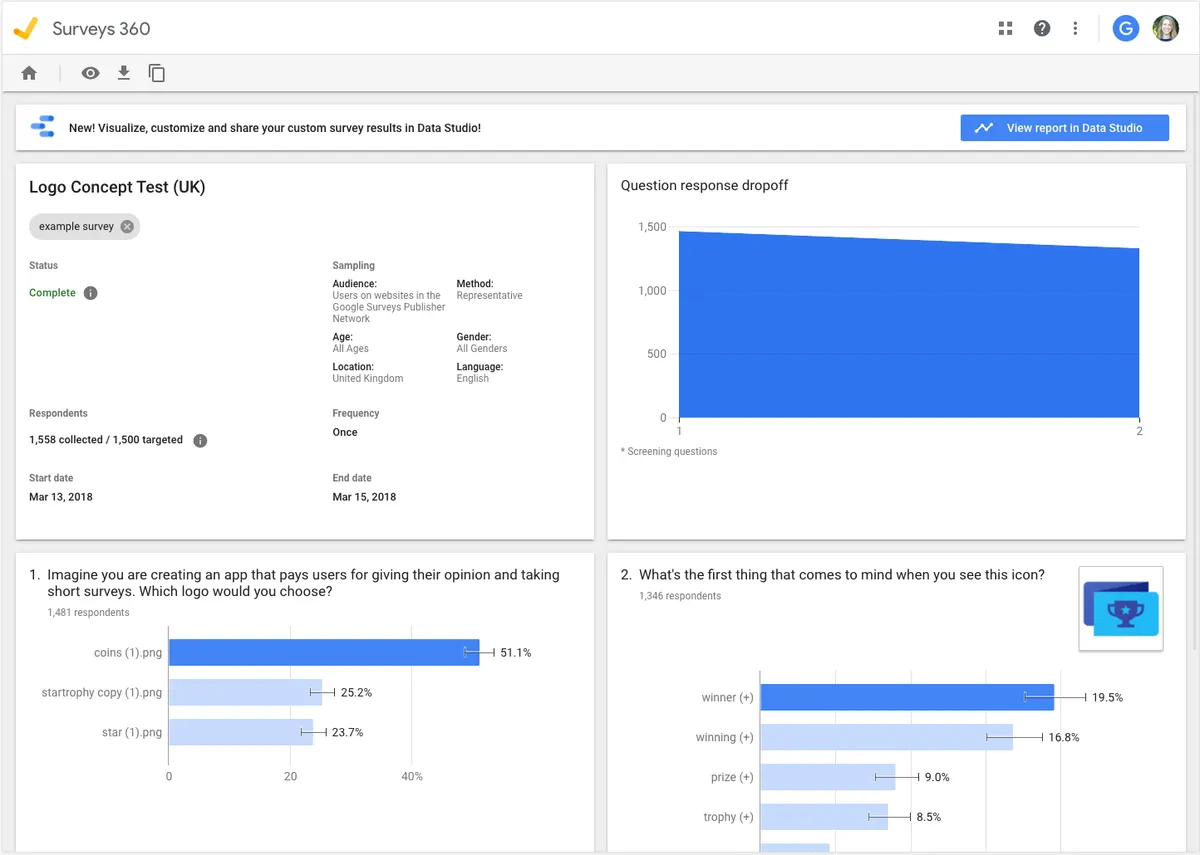
Google Surveys have long provided a cost-effective alternative to traditional, time-consuming market research. However, the limitation was always the siloed nature of the results. By clicking "View report in Data Studio," users can now push their survey data into a pre-configured template.
This is not merely a cosmetic change. By overlaying survey results—such as brand awareness or consumer sentiment—directly onto behavioral metrics from Google Ads, businesses can perform real-time correlation analysis. For instance, a brand manager can now visually observe how a specific ad campaign, tracked in Google Ads, directly influences the sentiment scores recorded in a concurrent Google Survey. This creates a feedback loop that allows for faster pivots in strategy.
The Shift to Google Analytics 4
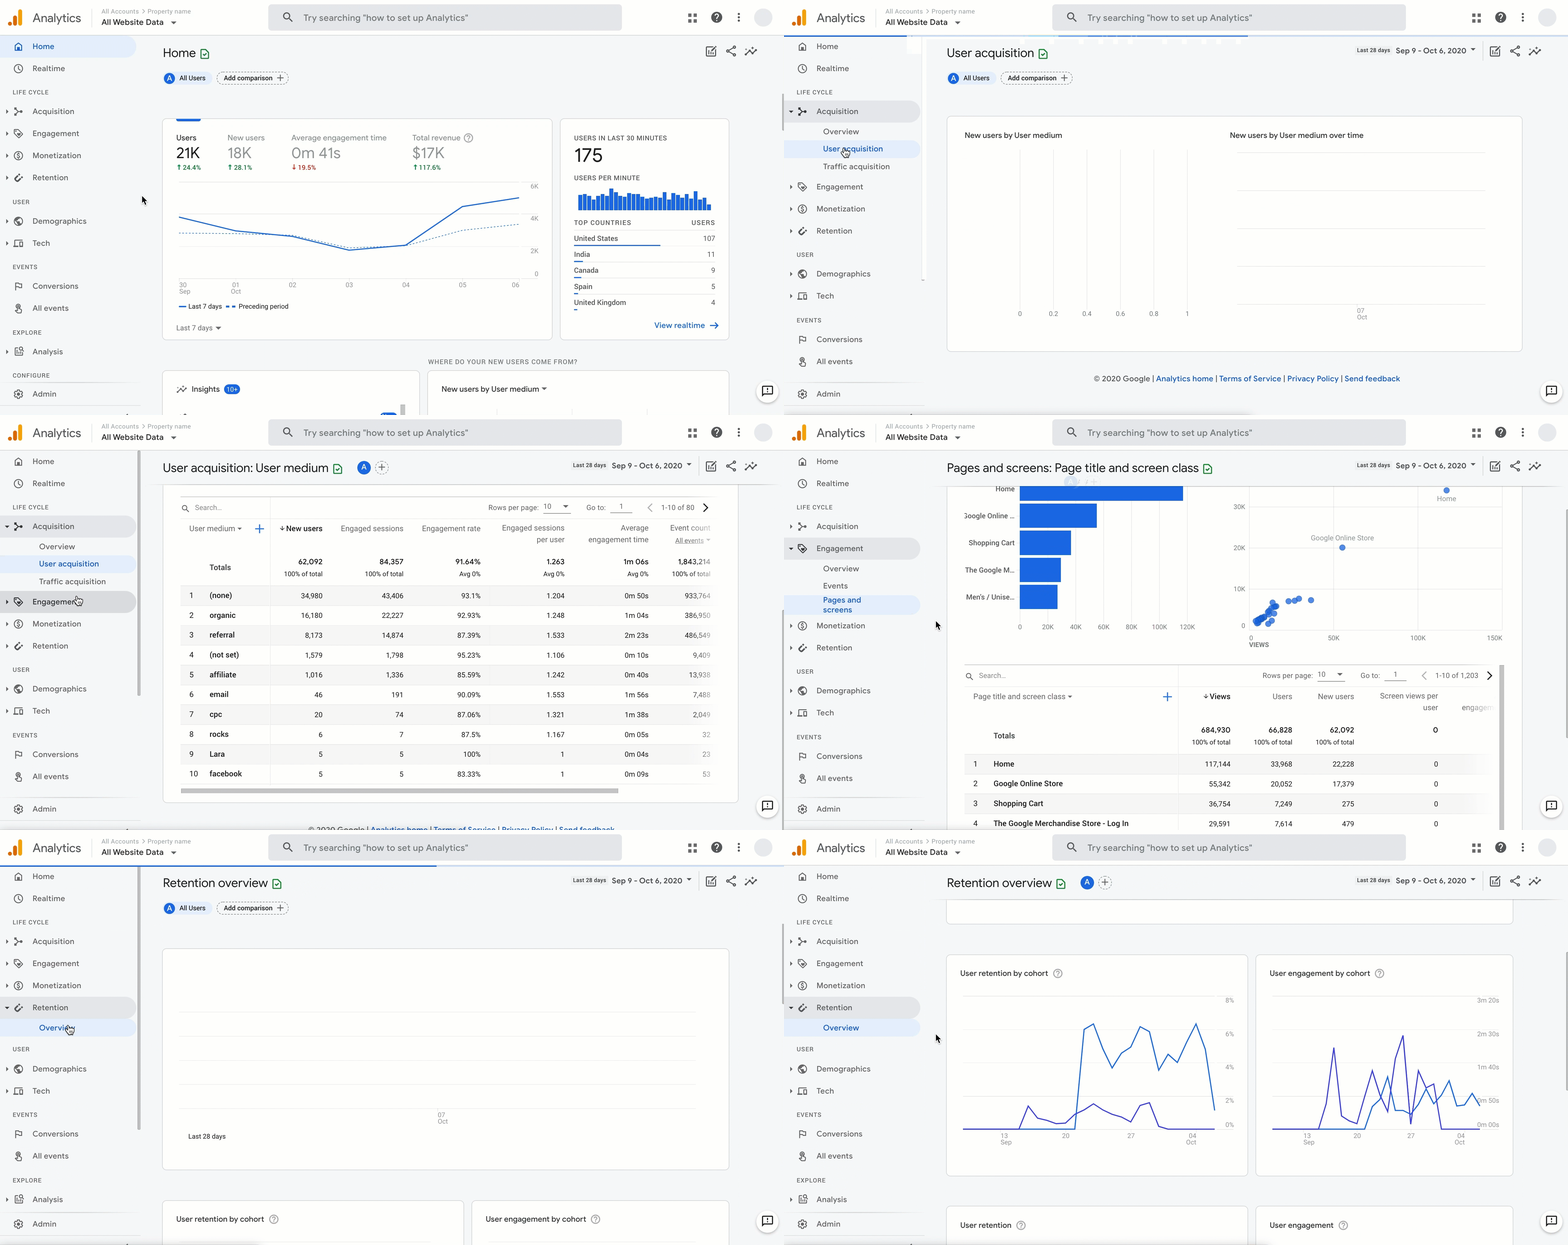
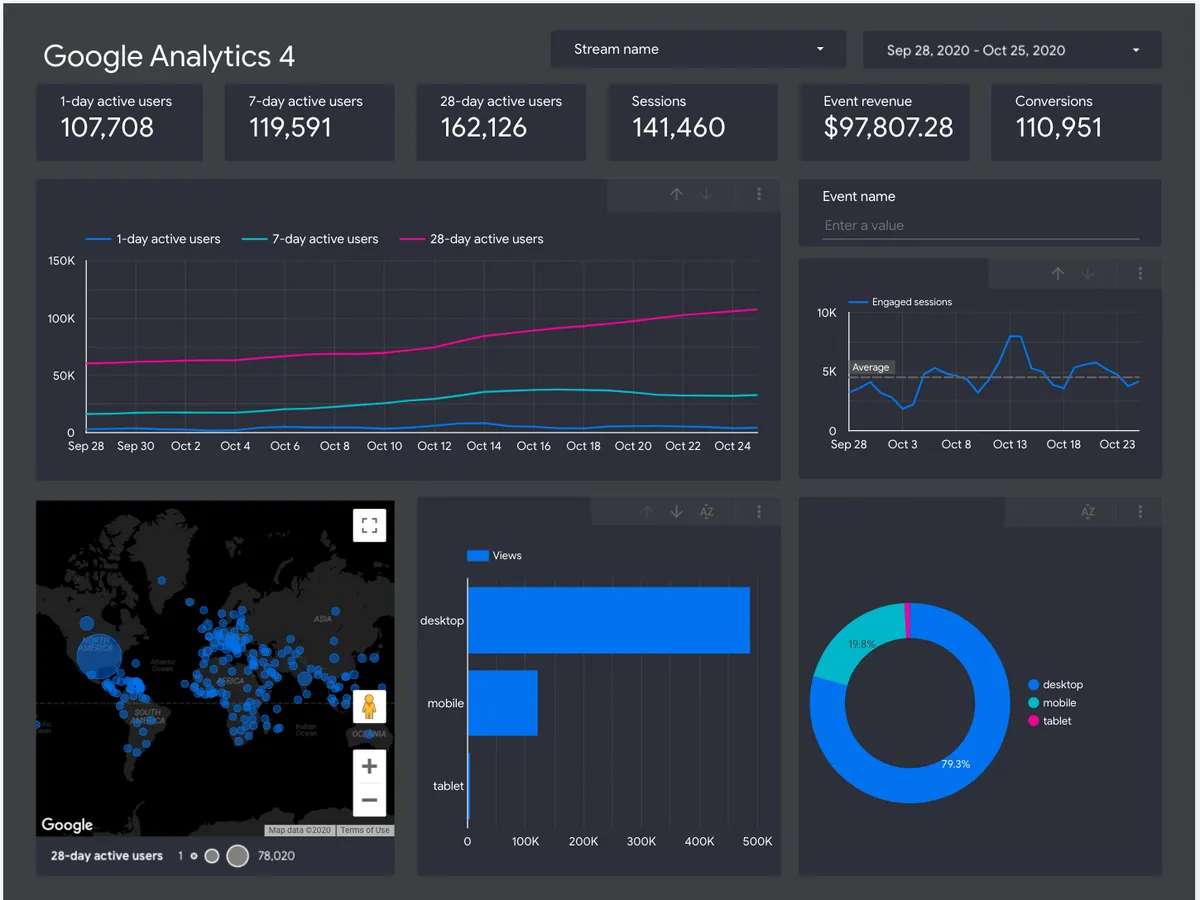
The introduction of GA4 support within Data Studio marked a foundational change in how businesses interpret web traffic. Unlike Universal Analytics, which relied heavily on cookies, GA4 is built on an event-based data model designed to function in a world where privacy regulations like GDPR and CCPA are increasingly stringent.
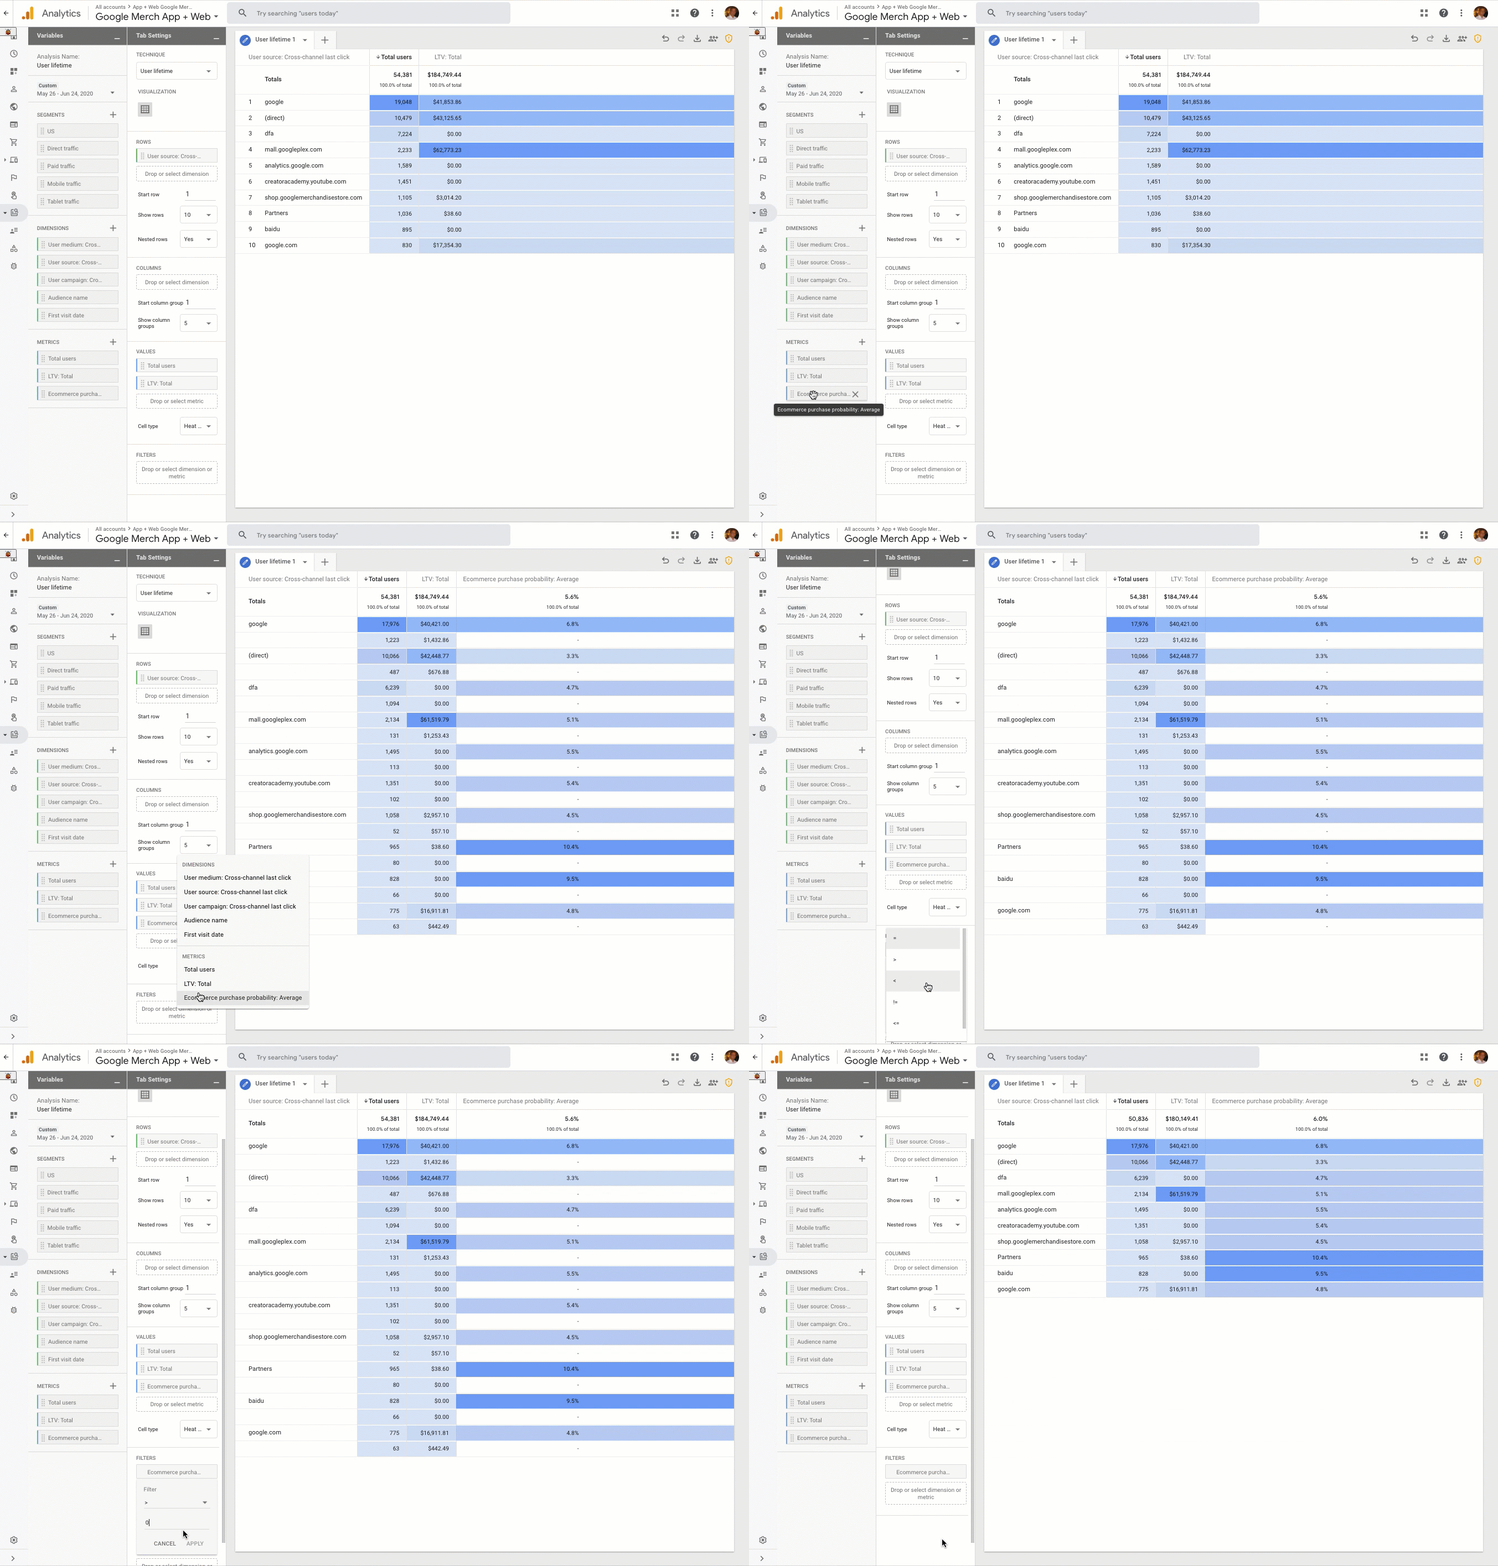
Integrating GA4 into Data Studio allows for a seamless transition for analysts who need to maintain reporting consistency while adopting the new measurement standards. Because GA4 data is structured differently, the native connector provides a necessary translation layer, allowing users to build dashboards that bridge the gap between legacy metrics and modern event-tracking.
Supporting Data and Industry Context
Industry reports suggest that organizations that utilize unified reporting tools see a significant increase in data-driven decision-making speed. According to market research from Gartner, firms that centralize their marketing data into a single source of truth experience a 20% to 30% reduction in time-to-insight.
Prior to this integration, the manual overhead of connecting data sets was a primary complaint among digital agencies. By allowing users to connect to over 300 data sets—including BigQuery for raw data storage and various CRM platforms—Google has transformed Data Studio into a scalable solution. For a mid-sized enterprise, this reduces the need for expensive third-party BI tools that often require lengthy onboarding periods.
Official Perspectives and Community Feedback
Mary Pishny, then-Product Manager for Data Studio, noted during the launch that the goal was to enable users to spend less time configuring and more time analyzing. The community reaction was largely positive, particularly from the agency sector. Analysts noted that the "Solution Gallery," which offers over 30 templates, served as an essential starting point for junior staff members, reducing the learning curve for complex data visualization.
Feedback from the Data Studio community forum suggests that while these connectors solved immediate problems, they also created a demand for more granular control over custom dimensions and metrics. Google has responded to this feedback over time by continuously updating the connectors to handle more complex event schemas from GA4.
The Broader Implications for Marketing Strategy
The ability to visualize diverse data streams in one place has profound implications for marketing accountability. When market research (Surveys) is paired with behavioral data (GA4) and financial data (Google Ads), the "Why" behind the "What" becomes clearer.
For example, if an e-commerce brand sees a dip in conversion rates, the traditional approach would be to look at the traffic logs. With these new integrations, the analyst can cross-reference that dip with a survey conducted during the same period, perhaps revealing that customers were dissatisfied with the checkout process or had concerns about pricing. This creates a holistic view of the customer journey.
Challenges and Limitations
Despite these advancements, the integration of such vast amounts of data brings its own challenges. Users must ensure that their data governance is robust. Because Data Studio pulls data in real-time or via cached connections, the burden of ensuring data accuracy lies with the user. The complexity of mapping GA4 events, for instance, requires a solid understanding of the underlying data structure. If the initial tracking implementation is flawed, the visualization in Data Studio will merely amplify those errors.
Furthermore, while the "one-click" templates are helpful for beginners, power users often require more sophisticated custom calculated fields and blended data sources. Google has addressed this by allowing users to blend data from different connectors, enabling them to compare performance across channels—for example, comparing the cost-per-acquisition (CPA) from Google Ads against the sentiment score of users from a specific region.
Future Outlook
As the digital landscape moves toward a cookieless future, the importance of first-party data—such as that collected via Google Surveys and GA4—will only grow. The role of visualization tools like Data Studio (now evolved into Looker Studio) will shift from simple report generation to becoming the primary command center for business intelligence.
By providing these connectors, Google has solidified its position as a gatekeeper of the digital marketing workflow. The ability to pull data from diverse ecosystems into a single, cohesive dashboard is no longer a luxury; it is a prerequisite for survival in a competitive digital economy. Organizations that leverage these tools to build a comprehensive data strategy will likely find themselves better equipped to navigate the volatility of modern consumer behavior and the complexities of the digital advertising ecosystem.
Ultimately, the goal remains the same: transforming raw, fragmented data into actionable intelligence that drives business growth. Whether through the integration of sentiment analysis or the adoption of modern event-based tracking, the evolution of Data Studio continues to provide the necessary infrastructure for the next generation of data-driven enterprises.