The Perils of Interpreting Daily COVID-19 Data and the Danger of Hasty Market Conclusions

During the height of the COVID-19 pandemic in early 2020, the intersection of public health reporting and financial market behavior became a focal point of intense scrutiny. On April 6, 2020, following a reported decline in new daily COVID-19 infections, the Dow Jones Industrial Average surged by over 1,600 points, or 7.73%. This market movement was largely attributed to investor optimism that the United States had reached a turning point in the viral outbreak. However, statistical analysis of the reporting methodologies reveals that such reliance on single-day fluctuations is fundamentally flawed, as the data are prone to significant "noise" and administrative lag.
The Anatomy of Data Volatility
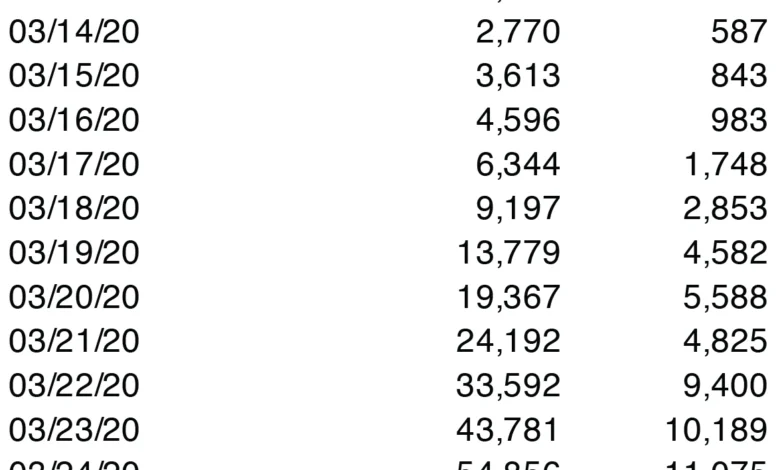
The reliance on raw, daily case counts as a barometer for the pandemic’s trajectory ignores the complexities of the reporting chain. In early April 2020, public perception was driven by headlines noting a drop in new cases—specifically, a decline from a record 34,196 on Saturday, April 4, to 25,316 on Sunday, April 5. Financial analysts and media outlets often seized upon these shifts as immediate signals for market adjustments.
However, statisticians and public health experts argue that these daily figures represent the date of reporting rather than the date of infection. Several systemic variables contribute to this volatility:

- Testing Capacity and Backlogs: In the early stages of the pandemic, access to diagnostic testing was inconsistent. Bottlenecks in laboratory processing meant that a surge in reported cases on one day often reflected a backlog of tests completed over the previous 48 to 72 hours, rather than a sudden spike in new transmissions.
- Reporting Delays: Data must travel from local clinics to county health departments, then to state authorities, and finally to the Centers for Disease Control and Prevention (CDC). Discrepancies in the speed of these reporting channels lead to artificial "dips" on weekends or holidays, followed by artificial "spikes" as data catch up during the work week.
- Under-reporting: A significant percentage of cases were asymptomatic or mild, meaning individuals never sought medical attention or testing. Consequently, the official figures were consistently a fraction of the actual infection count, making them a "proxy" at best, rather than an accurate census.
Chronology of Early April 2020 Reporting
A review of the data during this period highlights the danger of premature interpretation. On April 3, 2020, data indicated a steep increase in new cases, which sparked concern across financial and public sectors. By April 4 and 5, the reported numbers declined, leading to the aforementioned market rally on April 6.
When researchers expanded the dataset to include April 6, the narrative shifted significantly. The "turnaround" observed over the weekend proved to be a statistical mirage. When the additional day’s data were integrated, the trend line resumed its upward trajectory, demonstrating that the apparent decline was merely a temporary fluctuation within a broader, upward-moving curve. This sequence of events serves as a historical case study in why short-term data points are insufficient for predicting the epidemiological course of a pandemic.
Statistical Mitigation: The Case for Moving Averages
To filter out the noise inherent in daily reporting, experts advocate for the use of moving averages. By calculating a 5-day or 7-day moving average, analysts can smooth out the volatility caused by weekend reporting gaps and administrative delays.
When the data from early April 2020 are processed through a 5-day moving average, the dramatic peaks and troughs disappear, revealing a more consistent, albeit still concerning, upward trend. This method provides a more stable foundation for policy decisions and economic forecasting. By averaging the current day’s count with the preceding four days, the influence of a single, anomalous reporting day is minimized, offering a clearer picture of whether the infection rate is truly accelerating, stabilizing, or declining.

Implications for Public Policy and Economic Stability
The disconnect between actual infection rates and financial market reactions underscores the dangers of "data-driven" decision-making without a deep understanding of data provenance. When investors or policymakers react to a single day of data, they risk misallocating resources or triggering economic volatility based on artifacts of the reporting system rather than the reality of the public health situation.
Official responses from the CDC and other health organizations at the time consistently cautioned that models are "educated guesses" based on incomplete information. During the early stages of a global health crisis, the true trajectory is often only visible in retrospect. The rush to find patterns in the daily noise can lead to a false sense of security or, conversely, undue panic.
The Need for Long-term Perspective
As the pandemic progressed, the challenges of data accuracy only grew. As medical facilities became increasingly overtaxed, the probability of reporting errors, delays in testing, and gaps in data transmission increased. This environment necessitated a shift in how both the public and the media consumed pandemic-related statistics.
The primary takeaway for researchers and the public alike is the importance of patience and methodological rigor. As seen in the comparison between daily counts and moving averages, the "truth" of the pandemic’s progress was hidden within the volatility. Relying on hasty, day-to-day interpretations is not merely a statistical error; it is a failure to appreciate the logistical reality of how such massive datasets are compiled.

Broader Socio-Economic Impact
The influence of these statistics on the stock market represents a broader trend of "algorithmic anxiety," where financial markets react to news headlines in real-time. Because the market is designed to price in future expectations, the misinterpretation of health data leads to rapid, often counterproductive, capital shifts.
When the financial sector treats a single day’s lower case count as a signal of recovery, it may lead to an premature easing of social distancing compliance or an overextension of financial leverage. If that recovery is not supported by the underlying epidemiological data, the resulting market correction can be more damaging than the initial volatility.
Conclusion: Data Literacy in a Crisis
The events of April 2020 underscore the vital importance of data literacy. As the world navigates future crises, the ability to discern between meaningful trends and statistical noise will remain a critical skill for both policymakers and the public. We must move beyond the allure of the "latest number" and prioritize the long-term, smoothed trends that accurately reflect the state of public health.
The reality of a pandemic is that it is a complex, multifaceted phenomenon that cannot be reduced to a single daily integer. By acknowledging the limitations of our reporting systems and adopting more robust analytical tools, we can make decisions that are not only more informed but also more resilient against the volatility of the moment. Ultimately, the most accurate understanding of such events will only be reached through the lens of history, not through the rapid, often misleading, snapshots of the daily news cycle.