Visualizing a Global Crisis: The Critical Need for Clarity in COVID-19 Data Communication

The COVID-19 pandemic, which emerged in late 2019 and rapidly escalated into a global health emergency by early 2020, presented unprecedented challenges not only to medical professionals but also to data scientists and public health analysts. As governments worldwide struggled to contain the transmission of SARS-CoV-2, the ability to track and communicate mortality rates became a matter of public safety. However, the surge in data production led to a proliferation of complex, often opaque, visual representations of mortality that frequently hindered public understanding rather than facilitating it. Effective data visualization is essential for informed policymaking, yet many early attempts to map the pandemic’s progress suffered from poor design choices that obscured rather than clarified the severity of the situation.
The Complexity of Global Health Data Reporting
Comparing COVID-19 mortality across national borders is inherently fraught with statistical limitations. The primary challenge lies in the lack of a universal standard for death certification. In many jurisdictions, the distinction between a death "from" COVID-19 and a death "with" COVID-19 remained blurred throughout the early stages of the pandemic. For instance, if an individual suffering from chronic pneumonia contracted the virus and subsequently succumbed to respiratory failure, recording the underlying cause of death often fell to the discretion of individual practitioners under extreme pressure.
This variability in reporting protocols means that data from countries with robust, centralized health systems—such as Italy or South Korea—cannot be directly equated with data from regions where testing capacity or administrative oversight was limited. Furthermore, the focus of healthcare systems shifted rapidly from data hygiene to acute clinical intervention. When hospitals are overwhelmed, the rigorous administrative process required for accurate death documentation is often the first casualty of the crisis. Consequently, analysts must acknowledge that international comparisons of COVID-19 mortality are, at best, estimates that reflect relative trends rather than precise, absolute figures.
A Chronology of the Early Pandemic Response
The global trajectory of the virus can be categorized by distinct phases of reporting. In the initial weeks following the identification of the novel coronavirus in Wuhan, China, global health organizations were tasked with synthesizing fragmentary information. By February 2020, the focus shifted to East Asia, and by March, the World Health Organization (WHO) declared COVID-19 a pandemic, with Europe becoming the new epicenter.

During this period, the United States, Italy, and Canada adopted varying strategies for tracking mortality. Italy experienced a rapid, vertical increase in fatalities during March 2020, which served as a grim precursor for other Western nations. The United States, due to its decentralized healthcare infrastructure and varying state-level reporting requirements, faced significant delays in data consolidation. Canada, while managing its own domestic outbreak, saw a different rate of progression, characterized by localized clusters rather than the widespread saturation seen in Northern Italy. This timeline underscores why static, monolithic data representations—often attempting to force disparate national data sets into a single, confusing chart—failed to capture the nuanced realities of the pandemic’s spread.
The Pitfalls of Poor Data Visualization
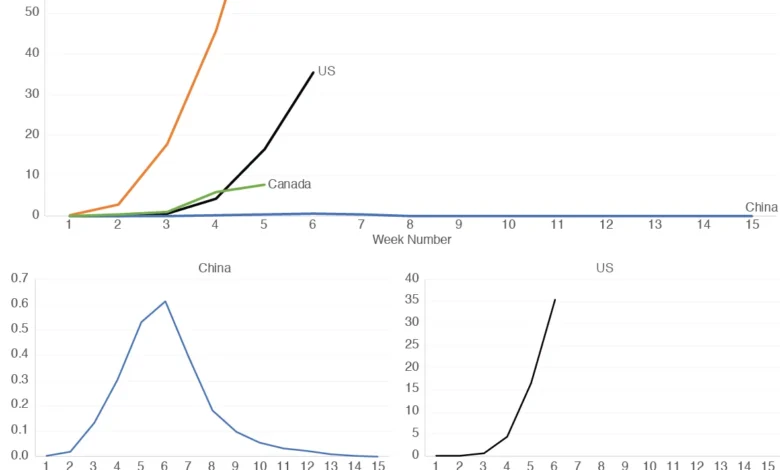
When analysts attempt to plot multiple countries on a single graph, they frequently encounter the "scaling problem." Because the magnitude of deaths per million people varies drastically—often by orders of magnitude—a single axis can render smaller countries invisible. For example, when comparing a country with a high mortality rate, such as Italy, against a country like China, which reported significantly lower per-capita mortality rates during that specific period, the resulting visual often displays China’s data as a flat line along the x-axis.
This is not merely a design flaw; it is a communication failure. By effectively flattening the data for certain regions, analysts inadvertently strip the graph of its utility for comparative study. While some experts advocate for the use of logarithmic scales to mitigate these discrepancies, such tools are often counterintuitive for the general public, who are generally more accustomed to linear representations. Using logarithmic scales to explain a public health crisis risks alienating the very audience—the general public—that needs the information most to understand social distancing mandates and the efficacy of public health interventions.
Improving Interpretability: A Multi-Graph Approach
To address these shortcomings, data scientists have moved toward a "complementary visualization" strategy. Rather than forcing all countries onto one chart, a more effective method involves using a primary graph to show the overall trend, supplemented by a series of smaller, individually scaled graphs for each country. This approach provides several distinct advantages:
- Independent Scaling: By allowing each country’s chart to scale according to its own peak, analysts can highlight the specific patterns of increase and decrease within that country, regardless of how it compares to the global average.
- Pattern Identification: This method allows for the direct visual comparison of infection "waves." For instance, observing the similarity in the early slopes of the mortality curves in China and Italy provides insights into the initial velocity of the virus in a dense, unprepared population.
- Temporal Analysis: A multi-graph layout allows for the inclusion of new, weekly data points without cluttering the existing narrative. It enables observers to see, for example, whether the U.S. began to exhibit a decline in mortality at the same stage in its outbreak cycle as its international counterparts.
Official Responses and Data Integrity
The reaction from international health bodies and government agencies regarding data reporting has been one of ongoing adjustment. The Centers for Disease Control and Prevention (CDC) in the U.S. and the European Centre for Disease Prevention and Control (ECDC) have repeatedly updated their guidelines on how to code COVID-19 deaths to ensure better consistency.

However, the consensus among epidemiologists remains that "official" numbers are always subject to revision. Retrospective analysis often reveals that excess mortality—the difference between the observed number of deaths and the expected number based on historical averages—is a more reliable metric than direct COVID-19 attributions. While this creates a more accurate historical record, it highlights the inherent lag in data availability, which presents a continuing challenge for real-time decision-making.
Broader Implications for Public Health Communication
The implications of how we visualize mortality data extend far beyond academic interest. Data visualization serves as the bridge between raw, chaotic statistics and the public’s perception of risk. When graphs are poorly designed, they can lead to public confusion, skepticism, or a dangerous underestimation of a threat.
The primary lesson of the early pandemic experience is that simplicity and clarity must take precedence over complexity. A chart that requires a background in statistics to interpret is a failure of communication. As public health agencies continue to provide data, the focus must remain on:
- Transparency of Sources: Ensuring that data origins, such as Our World in Data or official government health portals, are clearly cited.
- Contextual Framing: Providing the necessary background, such as population density or testing capacity, which influences the mortality numbers.
- Accessibility: Prioritizing visual designs that can be understood by a layperson in seconds, as these are the tools that drive individual behavior and collective adherence to safety measures.
Ultimately, while the data itself will always be imperfect, our methods for displaying that data must be as robust and transparent as possible. By adopting better design principles—such as separating scaled graphs and avoiding misleading logarithmic representations for general audiences—we can ensure that the public receives the information they need to navigate a crisis with confidence. The goal of data visualization is not simply to show the numbers, but to tell the story of the pandemic in a way that is accurate, actionable, and, above all, human. As we move forward, the integration of clear visual communication will remain a cornerstone of effective pandemic management, serving as an essential tool in the ongoing global effort to protect human life.