
The Evolution of Sports Marketing Measurement and the Strategic Shift Toward Business Impact Accountability
The modern media landscape has undergone a radical transformation over the last decade, yet one sector remains remarkably resilient to the fragmentation of audience attention: live sports. Recent data regarding the top 50 most-watched telecasts in the United States reveals a staggering trend where nearly every entry is a sporting event. While cultural milestones such as the 97th Academy Awards, the Saturday Night Live 50th Anniversary Special, a high-profile 60 Minutes interview, the 67th Grammy Awards, and select episodes of The Floor managed to break into the rankings, they represent the rare exceptions to a rule dominated by the gridiron, the court, and the pitch. Even an "NFL Weather Delay" secured the 27th spot in national viewership rankings, a testament to the fact that American audiences will remain tuned to a broadcast as long as it carries the imprimatur of professional sports.
This concentration of viewership has solidified sports as the final frontier of live, collective television consumption. In an era defined by asynchronous streaming and "on-demand" habits, sports provide a unique "water cooler" moment that advertisers crave. This reality explains the aggressive entry of streaming giants into the sports rights market. Companies like Amazon, Apple, and Netflix are no longer content with being repositories for prestige dramas; they are now multi-billion-dollar players in the acquisition of NFL, MLS, and WWE broadcasting rights. Consequently, marketers have responded with a massive influx of capital into sports-related advertising, encompassing everything from traditional stadium naming rights and kit sponsorships to high-frequency paid media campaigns.
The $38 Million Question: Accountability in the Executive Suite
As sports marketing budgets swell, corporate leadership is increasingly moving beyond the "glamour" of the partnership. While hospitality suites, celebrity meet-and-greets with icons like Tom Brady, and exclusive access to prestigious venues like Augusta National provide significant social capital for executives, the financial justification for these investments is under intense scrutiny. Senior leadership is now asking a fundamental question: Is a $38 million marketing investment actually driving measurable business growth?
The answer requires a departure from traditional "gut-feeling" marketing and a transition toward a rigorous, data-driven measurement framework. The challenge lies in the fact that sports marketing operates under the same fundamental laws as traditional marketing, but with higher stakes and greater complexity. Analysts point out that if a brand’s creative message is lost during a brief interaction on a social platform like TikTok, it is even more likely to be ignored when placed on the side of a racing car or a tennis sideboard. In these environments, the game is the primary focus, and the brand is often perceived as secondary noise.
The "Spike and Sustain" Philosophy
One of the most significant pitfalls in sports marketing is the "spike and silence" phenomenon. Brands often invest heavily in a single high-profile event, such as the Super Bowl or a World Cup final, only to go silent in the weeks that followed. Industry experts argue that this is the "kiss of death" for brand equity. Because the sport itself often acts as a distraction from the marketing message, achieving a "halo effect"—where the positive attributes of the sport or athlete are transferred to the brand—requires five times the effort compared to traditional channels.
A successful strategy requires "spike and sustain," where the initial visibility of a major sporting event is followed by consistent, high-frequency reinforcement. Research suggests that a frequency of at least three exposures per user per week is necessary to achieve persuasion. In the context of sports, this cannot be achieved through organic placement alone. It requires a sophisticated mix of "organic" presence (such as a logo on a jersey) and aggressive paid media that utilizes the athlete or the sport within the creative storytelling.
A Five-Level Framework for Impact Measurement
To navigate the complexities of sports marketing, a sophisticated measurement playbook has emerged, categorized into levels of increasing sophistication. This framework, often used to evaluate partnerships—such as a hypothetical collaboration between a tech firm like CloudPixel and a Major League Soccer team like the San Jose Earthquakes—allows companies to move from vanity metrics to true financial incrementality.
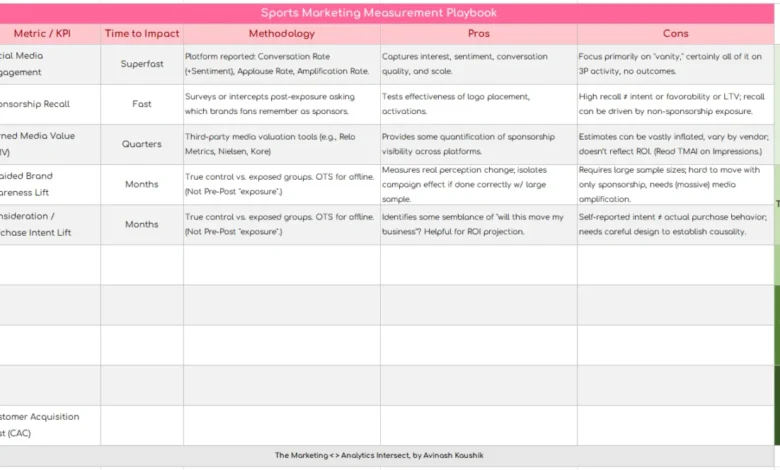
Level 5: The Vanity Metrics and Opening Gambit
Most brands begin their journey at Level 5, which focuses on "Big Numbers" that look impressive in boardroom presentations but offer little insight into actual business outcomes. This level measures activity rather than impact.
- Social Media Engagement: This includes tracking Conversation Rates, Applause Rates, and Amplification Rates across social platforms. While these metrics provide immediate feedback and are often free to track, they represent "noise" rather than value.
- Sponsorship Recall: This is often measured through post-exposure surveys. However, experts warn that "aided recall" (asking if a consumer recognizes a specific sponsor) often provides low-signal quality. "Unaided recall" is considered a much higher bar for success.
- Earned Media Value (EMV): Frequently used by agencies, EMV (or Ad Value Equivalency) calculates what it would have cost to buy the same amount of exposure through traditional ads. This metric is increasingly discredited by major marketing associations because it assumes all exposure is equal, ignoring audience relevance and the cluttered nature of the sports environment.
Level 4: The Quest for Brand Impact
Level 4 represents a significant upgrade in sophistication, moving toward a "test vs. control" methodology to understand how a sponsorship shifts human perception. This stage is critical for both B2C and B2B companies with long sales cycles.
- Unaided Brand Awareness (UBA) Lift: UBA is a long-term driver of revenue. A successful sports program should move this needle over time, though it requires a multi-year commitment.
- Consideration and Purchase Intent: This is the point where the Chief Financial Officer (CFO) typically begins to take interest. Moving a brand into the "top three" choices for a consumer or business decision-maker is a proven indicator of medium-term revenue impact.
Measuring Level 4 requires traditional brand tracker instruments and panels, comparing an "Exposed" group (those who watched the match or saw the ads) against a "Control" group (those with no exposure). Advanced techniques like propensity score matching are used to ensure the groups are comparable, accounting for external variables such as competitor activity or broader economic shifts.
The Strategic Utility of "Borrowed Equity"
A "dirty secret" of the sports marketing industry is that many brands struggle with original storytelling. Creative execution is estimated to be responsible for 60% to 70% of all brand marketing success. For companies that find it difficult to develop compelling narratives in-house, sports marketing offers a shortcut. By sponsoring an athlete or a team, a brand can "inherit" the values of that entity—such as resilience, excellence, or speed.
However, this "borrowed equity" is only profitable if it is backed by significant paid media. Analysts suggest that simply having a logo on a water bottle or a jersey is insufficient. The brand must actively tell its story through the lens of the sport, using the partnership as the creative foundation for a broader, multi-channel campaign.
Chronology of a Sponsorship: From Launch to Maturity
The timeline for sports marketing impact is notably longer than that of digital performance marketing.
- Months 1-3: Focus is primarily on Level 5 metrics. Brands establish baselines for social engagement and initial sponsorship recall.
- Months 6-12: The transition to Level 4 measurement begins. Companies look for initial shifts in brand sentiment and consideration among "super-fans" and core demographics.
- Years 2-5: This is the "maturity phase" where the compounding advantage of the partnership begins to manifest. It is during this period that Level 3 through Level 1 measurements—focusing on digital traces, heart-and-mind influence, and ultimately, financial incrementality—become the primary drivers of strategy.
Broader Implications and the Future of Sports Media
The shift toward high-level measurement reflects a broader trend in the global economy: the demand for accountability in "top-of-funnel" spending. As the cost of sports rights continues to escalate—exemplified by the multi-billion dollar deals for NFL Sunday Ticket and the NBA’s upcoming rights negotiations—the pressure on brands to prove ROI will only intensify.
Furthermore, the integration of Artificial Intelligence in sports broadcasting is opening new avenues for measurement. Computer vision can now track exactly how many seconds a logo is visible on screen, the clarity of that visibility, and even the emotional state of the crowd during the exposure. While this provides more granular data for Level 5 metrics, the true "gold standard" remains Level 1: proving that a specific sports marketing investment drove a sale that would not have happened otherwise.
In conclusion, sports marketing remains one of the most powerful tools in a CMO’s arsenal, capable of transformative impact, as seen in long-term partnerships like Rolex and professional tennis. However, the era of "sponsoring in the dark" is coming to an end. By moving through the levels of measurement sophistication, from vanity metrics to causal brand impact, organizations can ensure that their multi-million dollar investments are not just providing hospitality for executives, but are fundamentally altering the business’s growth trajectory. The lights are being turned on, and the brands that embrace this transparency are the ones most likely to win the long game.


