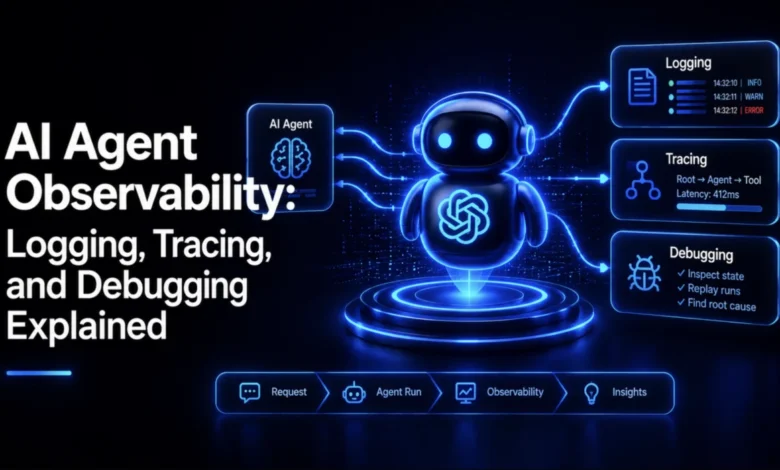
In the evolving landscape of enterprise software, the transition from traditional, deterministic services to non-deterministic, agentic AI systems has rendered legacy monitoring tools increasingly obsolete. As organizations deploy AI agents to handle complex, multi-step workflows—such as automated customer support, financial reconciliation, or supply chain orchestration—the margin for error has shifted from binary system failures to subtle, semantic inaccuracies. An agent might successfully complete a process without triggering a single error log, yet arrive at a conclusion that is entirely factually incorrect. This phenomenon, often termed "silent failure," represents the primary challenge in modern observability. Unlike traditional applications that throw exceptions when they break, AI agents can hallucinate, engage in redundant tool loops, or suffer from context overflow, all while reporting a "200 OK" status to standard monitoring dashboards.
The Shift in Failure Modes
The core of the problem lies in the unpredictability inherent in Large Language Model (LLM) architectures. In a traditional service, input A consistently yields output B. In an agentic system, input A might trigger a different sequence of tool calls based on model temperature, retrieved context, or transient tool availability. This lack of determinism means that traditional performance metrics—such as requests per second or CPU utilization—fail to capture the health of the system.
For engineers, the cost of these systems has also shifted. Traditional monitoring focuses on latency driven by network and I/O constraints; AI observability must prioritize token consumption and context window management. A single "slow" request in an agentic system is often not a result of infrastructure bottlenecks, but rather a symptom of a runaway token loop or an excessively large prompt that requires repeated processing. Furthermore, privacy concerns complicate standard logging; dumping raw prompt text into a backend monitoring service can lead to significant data compliance breaches, necessitating a more nuanced approach to data capture.
Reimagining the Three Pillars of Observability
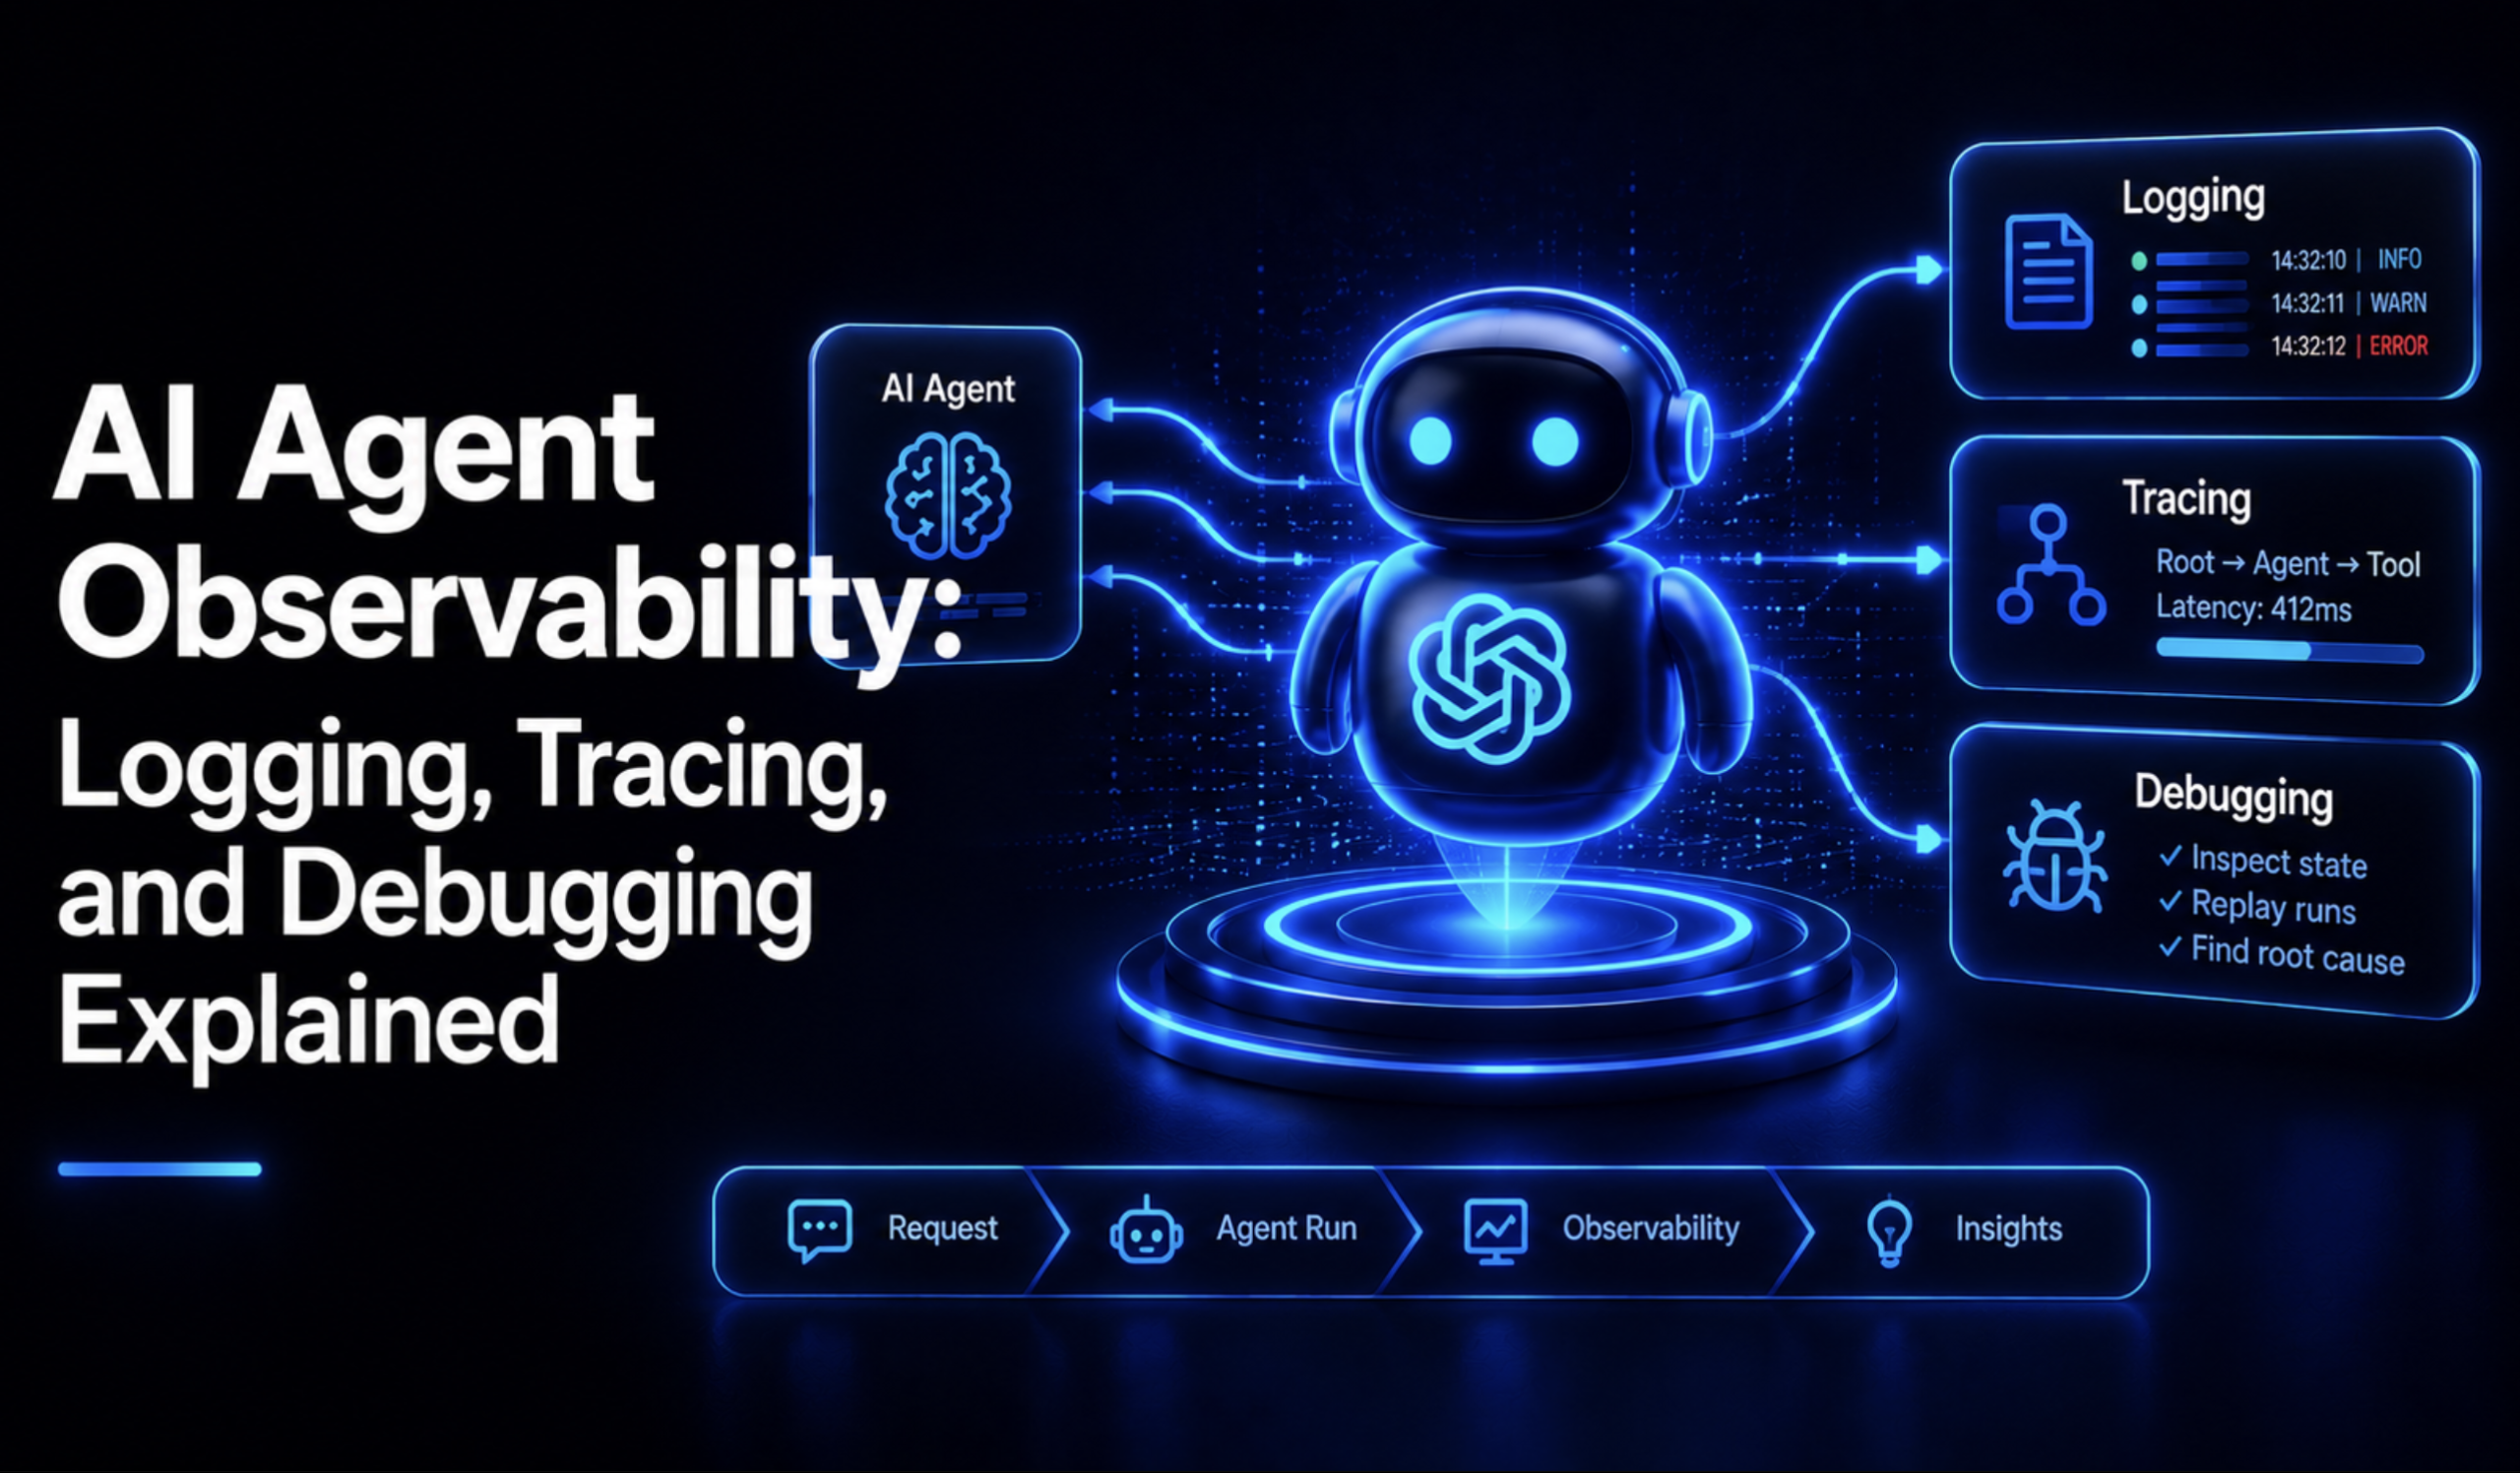
Effective AI agent observability requires a reimagining of the classic observability pillars: logs, metrics, and traces. While these concepts remain relevant, their implementation must be tailored to the unique requirements of agentic reasoning.
Logging must move beyond free-text statements. By implementing structured logging, engineers can attach metadata—such as trace IDs, tool names, and argument summaries—to every event. Crucially, logs must be tied to a specific execution context. Without a persistent trace ID, logs from multiple concurrent agent runs become an indecipherable jumble. By leveraging frameworks like OpenTelemetry, developers can ensure that every log line is associated with a specific span, allowing for rapid filtering when a production incident occurs at 2:00 AM.
Tracing, meanwhile, provides the structural "waterfall" view necessary to visualize the reasoning chain. It is not enough to know that a tool was called; one must understand the model’s reasoning process that preceded the call. By utilizing semantic conventions for GenAI, such as those defined by OpenTelemetry, teams can standardize span types—like invoke_agent, chat, and execute_tool. This standardization allows for cross-team consistency, ensuring that a trace generated by one framework is readable and actionable by another.
Metrics and the Economics of AI
The economic dimension of agentic systems cannot be ignored. Metrics must now track "gen_ai.client.token.usage" as a counter and "gen_ai.client.operation.duration" as a histogram. Splitting token tracking into input and output types is a critical best practice. If the ratio of input tokens to output tokens consistently exceeds 10:1, it serves as a leading indicator of a bloated system prompt that is wasting resources and potentially confusing the model.
Real-world monitoring should alert on specific patterns:
- Runaway Loops: Token usage rates doubling the baseline over a 10-minute window.
- Model Overload: P99 operation durations exceeding 30 seconds.
- Context Bloat: Input-to-output ratios that signal inefficient prompt engineering.
- Error Spikes: Sustained error rates above 2% in tool execution, often indicating rate limiting or authentication issues with external APIs.
The Role of Telemetry Pipelines
Managing this volume of data requires a robust middle layer, typically an OpenTelemetry Collector. This pipeline allows for the transformation and sanitization of data before it reaches the backend. For instance, sensitive information like full user prompts or proprietary API keys can be stripped from the trace data via configuration, ensuring that the observability stack remains compliant with GDPR, HIPAA, or internal security standards.
The introduction of Model Context Protocol (MCP) tracing has further refined this process. By enriching existing spans with metadata—such as mcp.method.name and mcp.session.id—teams can gain visibility into the protocol layer without increasing the noise of their trace visualizations. This level of granularity is essential when debugging complex, multi-agent orchestrations where the hand-off between different agents or MCP servers is a frequent point of failure.
Advanced Debugging: From Guessing to Replay
Once the telemetry infrastructure is in place, the debugging workflow is transformed. Instead of relying on guesswork or attempts to replicate the prompt manually, engineers can pull the trace ID from a reported issue, view the waterfall, and identify the exact step where the logic diverged.
Advanced teams are moving toward "time-travel" debugging, where the state of the agent can be restored at a specific step in the trace, allowing for a re-run of that isolated component. Additionally, natural-language query capabilities are emerging within platforms like LangSmith, enabling developers to ask high-level questions such as, "Why did the agent enter this recursive tool-calling loop?" The platform then performs the analysis of the trace data, providing an immediate answer.
The 2026 Observability Ecosystem
The tooling market has matured significantly to support these requirements. As of 2026, the industry is segmented by deployment models:
- Self-hosted platforms (e.g., Langfuse, Arize Phoenix): Preferred by enterprises with strict data residency mandates, offering total control over infrastructure at the cost of operational overhead.
- Managed SDKs (e.g., LangSmith, Braintrust): Ideal for teams prioritizing velocity, offering integrated evaluation and debugging tools out of the box.
- Proxy Gateways (e.g., Helicone): Provide a "zero-code" approach to logging and cost monitoring by sitting in front of LLM traffic, though they introduce a potential point of failure.
Implications for the Future
The shift toward agentic AI is as significant as the transition to cloud-native computing. Just as the industry eventually coalesced around standardized observability practices for microservices, it is now doing the same for AI agents. The key takeaway for any organization building these systems is that observability is not an optional "nice-to-have"—it is a foundational requirement for production readiness. Without the ability to inspect the reasoning chain, quantify token costs, and reconstruct failed runs, AI agents remain "black boxes" that are inherently unsuitable for critical enterprise workflows. The teams that successfully navigate this transition will be those that treat their agent telemetry with the same rigor they apply to their core application performance data.