The Essential Guide to Mastering Social Media Metrics and Key Performance Indicators


In the contemporary digital landscape, the volume of data generated by social media platforms often exceeds the capacity of marketing teams to effectively synthesize it. While the temptation exists to monitor every available data point—from total follower counts to individual post impressions—data volume is not synonymous with data quality. The strategic challenge for modern organizations lies in distinguishing between vanity metrics, which offer superficial validation, and actionable metrics that inform substantive business outcomes. By aligning social media activity with specific, measurable business objectives, organizations can transition from passive observation to data-driven decision-making.

The Distinction Between Metrics and Key Performance Indicators
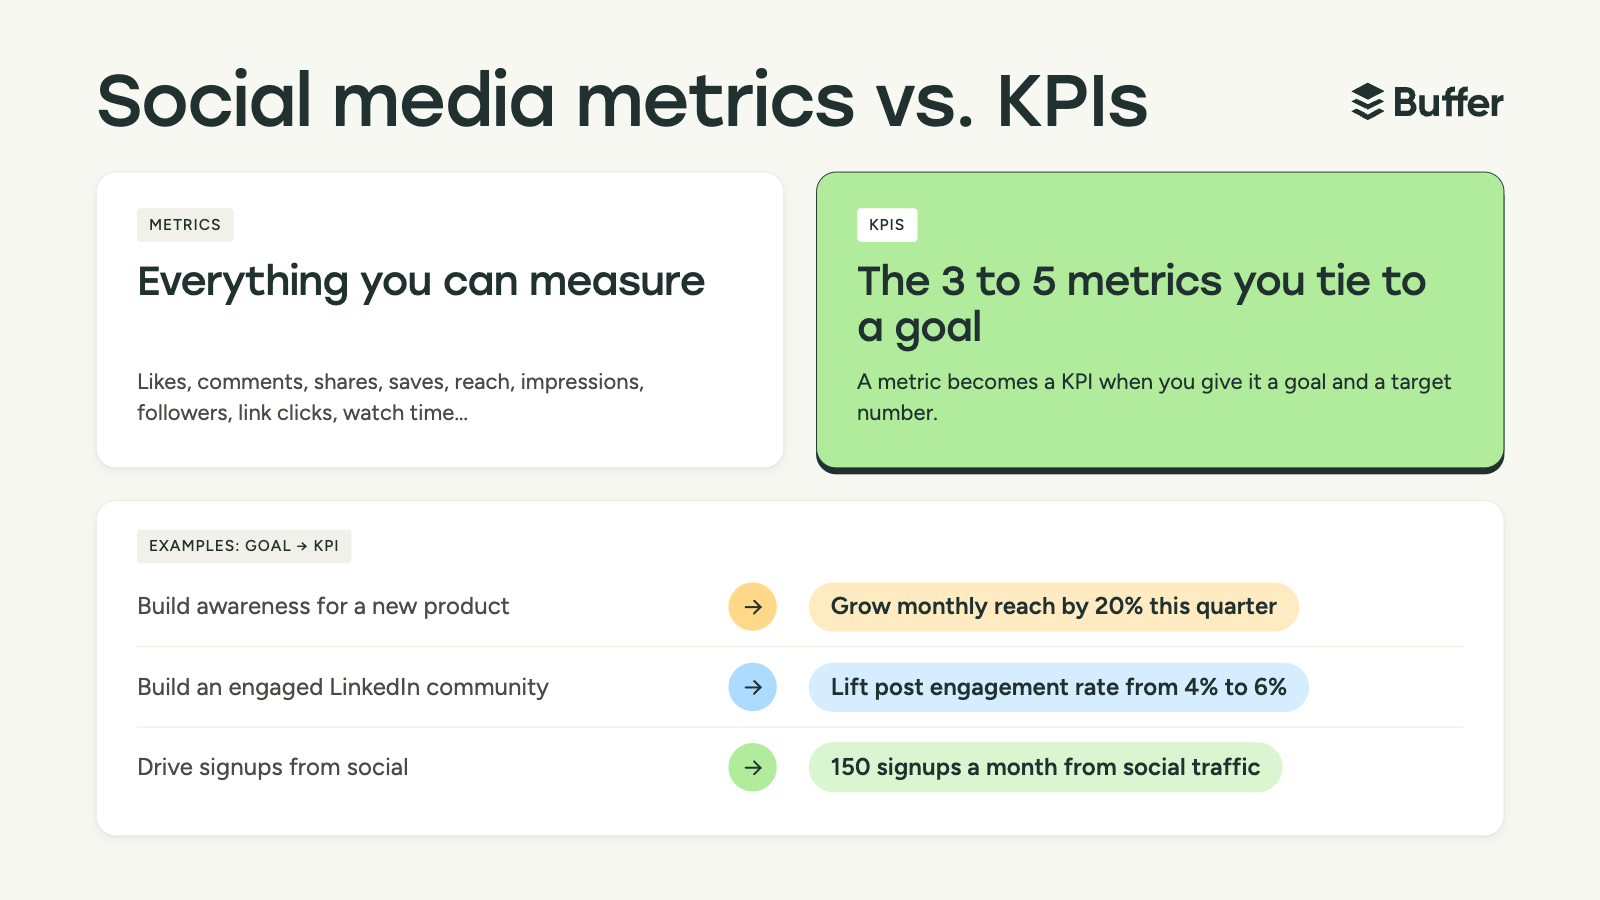
The foundational step in any robust social media strategy is the clear delineation between a metric and a Key Performance Indicator (KPI). A metric is any quantifiable data point generated by social activity, such as a "like," a share, or a follower count. These data points provide a granular view of specific audience interactions. Conversely, a KPI is a strategic tool—a metric that has been explicitly tied to a defined organizational goal and a specific, time-bound target.
For instance, if an organization’s primary goal is to increase website traffic, the relevant KPIs would be click-through rate (CTR), total social referral traffic, and conversion rate. By establishing a baseline—for example, a current CTR of 0.8%—a marketing team can set a realistic target, such as 1.2% by the end of the quarter. Without this context, data remains anecdotal; with it, data becomes a roadmap for performance improvement.
Evaluating Engagement: Beyond the Surface
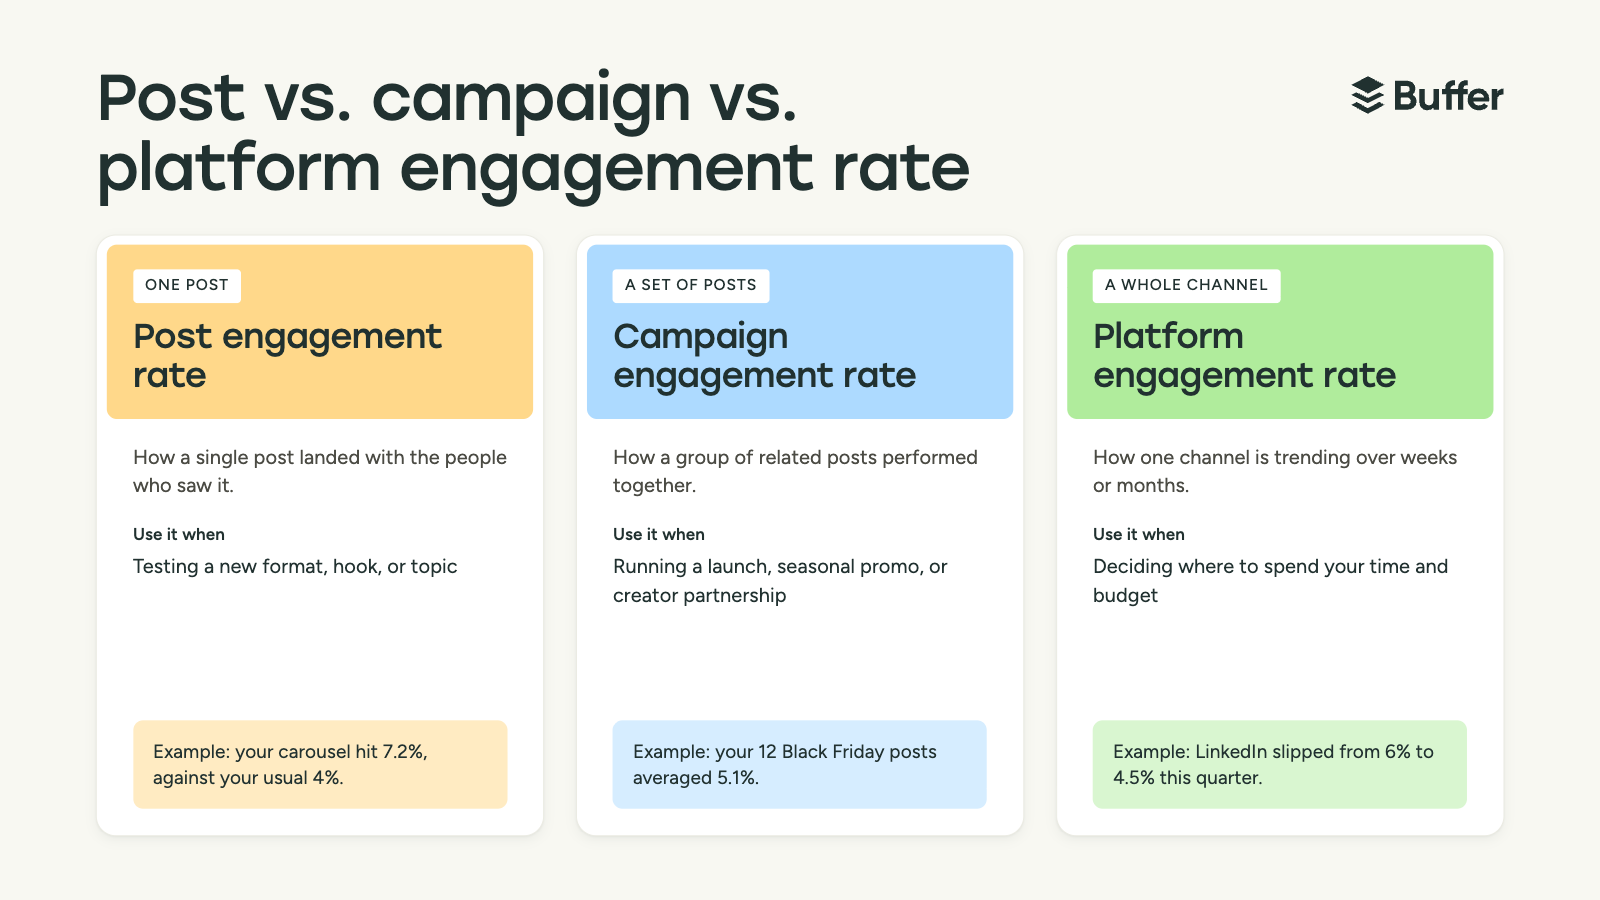
Engagement metrics serve as the primary indicator of how effectively content resonates with a target audience. As of late 2026, industry data derived from over 52 million posts across 200,000 accounts indicates that engagement rates vary significantly by platform. LinkedIn currently commands a median engagement rate of approximately 6.2%, while platforms like X (formerly Twitter) sit at 2.5%, and Instagram at 5.5%. These variations underscore the necessity of benchmarking performance within a single platform rather than comparing across disparate ecosystems.
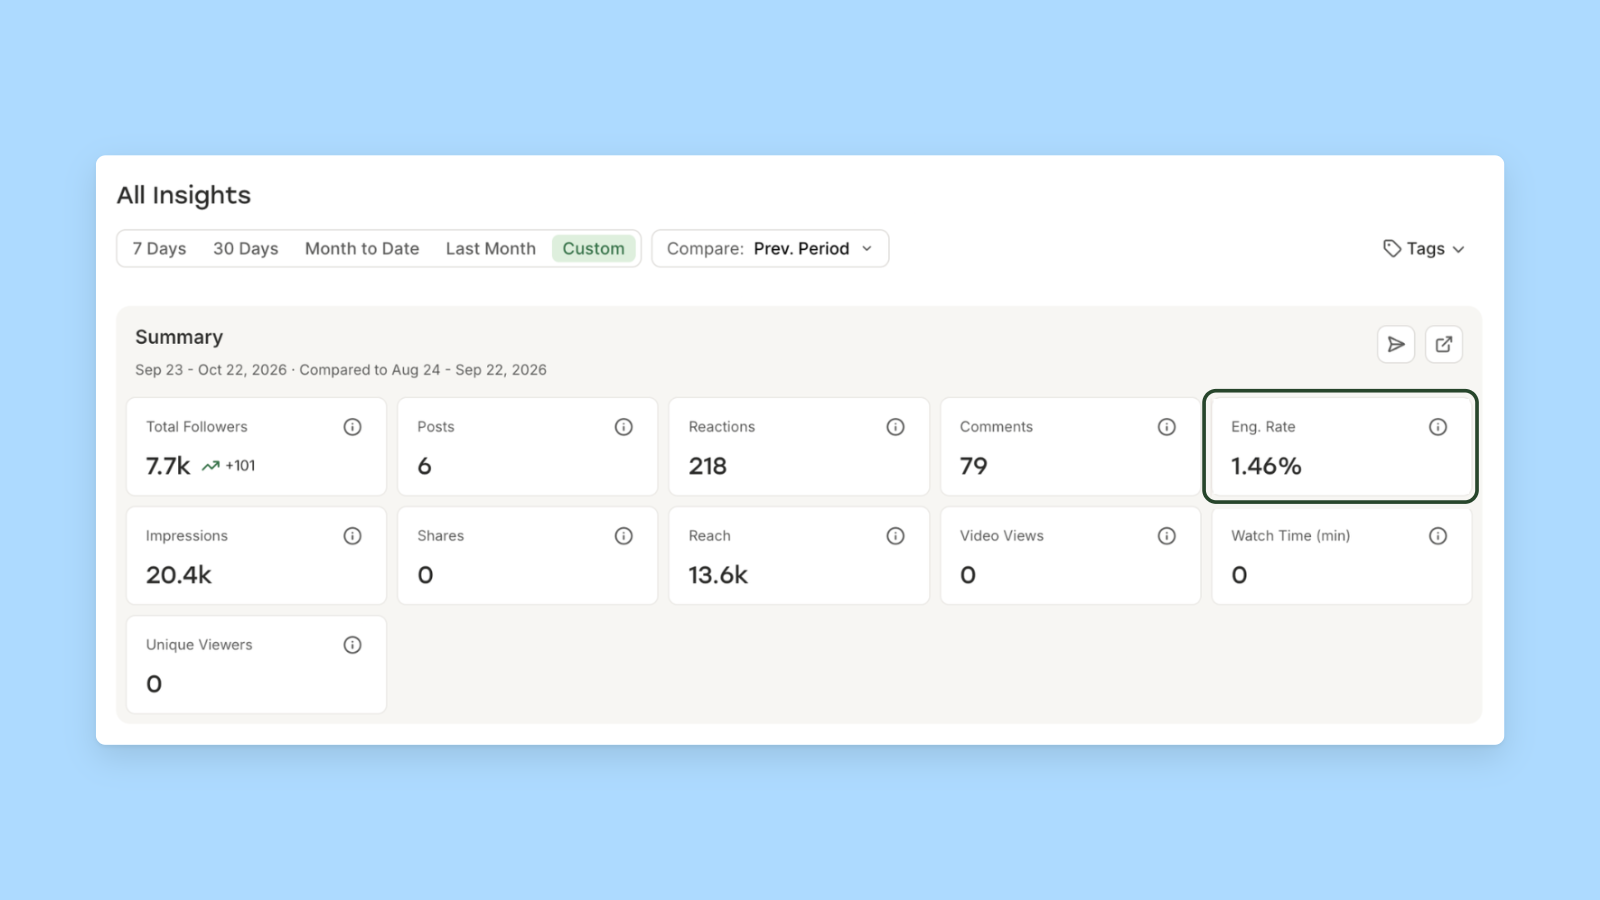
The engagement rate, calculated as total engagements divided by reach multiplied by 100, remains the industry standard for assessing content performance. However, high-performing marketers increasingly look at qualitative engagement markers. Comments, for example, represent a deeper level of audience investment than a simple reaction. Research suggests that accounts which actively reply to comments see a measurable uplift in overall engagement compared to those that remain passive. This reciprocal relationship between brand and user is essential for community building and long-term audience retention.
Reach, Impressions, and the Myth of Virality
Reach and impressions are frequently conflated, yet they serve distinct analytical purposes. Reach measures the number of unique accounts that have viewed a piece of content, while impressions count the total number of times that content has appeared on a screen, including repeat views by the same user.
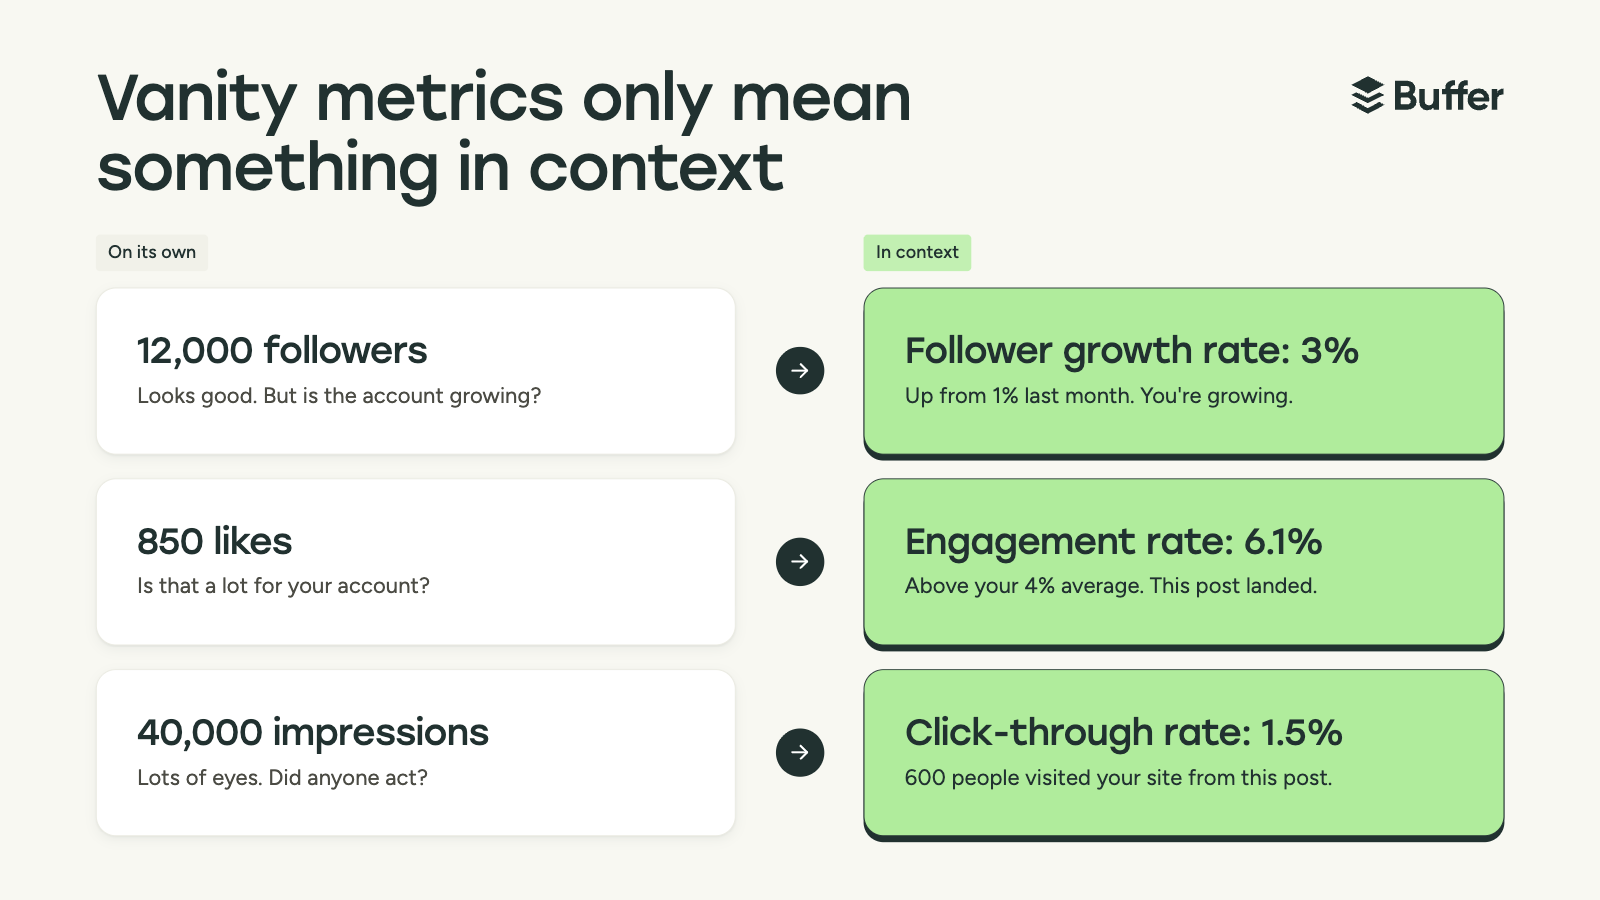
The pursuit of "virality"—characterized by massive, rapid increases in impressions—is often misaligned with business objectives. A post may generate millions of impressions yet fail to move the needle on lead generation or product sales. Industry experts emphasize that while high impressions are useful for top-of-funnel brand awareness, they are not a proxy for business success. If a post reaches a vast audience but fails to drive followers or clicks, it serves as a "vanity" metric. True strategic value is found in optimizing for reach among a specific, targeted demographic that matches the organization’s customer profile.
Audience Growth and Demographic Alignment
Follower growth rate is a vital indicator of an organization’s ability to attract and retain an audience over time. While the total number of followers is a standard indicator of a brand’s scale, the growth rate provides a more accurate picture of momentum. A stagnation in follower growth, even when content volume remains constant, often signals a disconnect between content strategy and audience expectations.
Demographic analysis complements growth metrics by providing clarity on the identity of the audience. If the actual audience demographic deviates from the target persona—for example, an enterprise software company attracting a student-heavy audience—the organization must adjust its content strategy. By pivoting toward content that addresses the specific pain points of the desired audience, marketers can align their follower base with their business objectives.

Brand Health and Sentiment Analysis
Brand health metrics offer a view of the external conversation surrounding an entity. Brand mentions, sentiment analysis, and share of voice are critical for crisis management and long-term brand positioning. Sentiment analysis tools, which utilize natural language processing to categorize mentions as positive, negative, or neutral, allow organizations to quantify the public’s perception of their brand.
Share of voice, calculated by comparing a brand’s mentions against the aggregate mentions of key competitors, provides a snapshot of competitive standing. A consistent decline in share of voice, even when a brand’s own mention volume remains stable, often indicates that a competitor is gaining market traction. Monitoring these metrics enables brands to adapt their messaging or ad spend in real-time to maintain competitive relevance.
Conversion and the Economics of Social Media
Conversion metrics are the final bridge between social media activity and financial performance. Click-through rate (CTR) is the primary metric for evaluating the efficacy of social posts in driving traffic to external properties. Once a user arrives at a landing page, the conversion rate—the percentage of visitors who complete a desired action—becomes the ultimate measure of success.
For organizations utilizing paid social advertising, the economic metrics of Cost-Per-Click (CPC), Cost-Per-Thousand-Impressions (CPM), and Return on Ad Spend (ROAS) are paramount. ROAS, in particular, measures the direct revenue generated for every dollar spent on advertising. To avoid the limitations of platform-specific data, many marketers now utilize "Blended ROAS," which calculates total revenue across all digital channels relative to total advertising expenditure. This holistic approach accounts for the reality that a user may interact with a brand across multiple touchpoints before converting.

The Operational Reality: A Data-Driven Routine
The complexity of tracking 20 or more distinct metrics can lead to "analysis paralysis." To manage this, professionals should adopt a systematic routine. Weekly reviews should focus on content-level performance—such as engagement and reach—to guide creative adjustments. Monthly reviews should focus on the 3–5 core KPIs that align with the current quarter’s business goals. Finally, a quarterly audit provides the necessary space to evaluate whether current social media platforms and strategies remain aligned with the organization’s overarching vision.
Most platforms now offer native analytics tools sufficient for basic monitoring. However, as organizations expand their presence across multiple channels, the necessity of third-party aggregation tools becomes clear. These platforms centralize data into a unified dashboard, eliminating the inefficiency of manual data entry into spreadsheets and providing a longitudinal view of performance that individual platform tools cannot match.

Strategic Implications
The trajectory of social media marketing is moving toward increased accountability. As marketing budgets face greater scrutiny, the ability to connect social activity to revenue, customer retention, and brand sentiment is no longer optional. By focusing on actionable metrics—those that provide clear, directive insights for future campaigns—marketers can shift their role from content creators to strategic assets within the organization. Success in the modern social media landscape is not defined by the volume of content produced or the number of likes acquired, but by the measurable progress made toward established, long-term business goals.