The Role of Data Visualization in Shaping Public Perception During the COVID-19 Pandemic

In the midst of the global COVID-19 pandemic, the clarity and accuracy of data presentation have become paramount to public understanding. News organizations serve as the primary conduits for this information, yet the way data is synthesized and visualized can inadvertently lead to significant misinterpretations. A recent examination of an August 5, 2020, report by NPR, titled "Charts: How the U.S. Ranks On COVID-19 Deaths Per Capita — And By Case Count," highlights the complexities inherent in translating raw epidemiological statistics into digestible public narratives. The article, which served as a response to a widely publicized Axios interview between former President Donald Trump and journalist Jonathan Swan, underscored the friction between political rhetoric and statistical reality.
The Axios Interview and the Context of the Debate
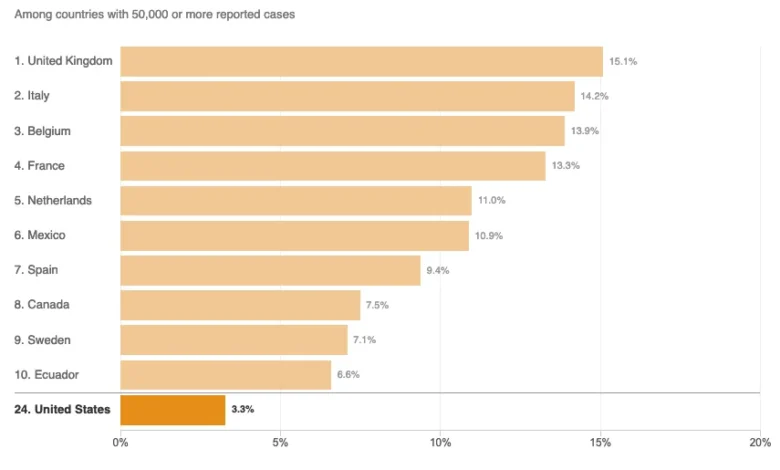
The discourse surrounding U.S. mortality rates intensified following the August 3, 2020, HBO broadcast of the Axios interview. During the exchange, President Trump defended the administration’s management of the pandemic by citing specific metrics that suggested the United States was outperforming other nations. When challenged by Jonathan Swan regarding the severity of the U.S. death toll, the President presented a chart focused on the "case fatality ratio"—the proportion of deaths among those who have tested positive for the virus.
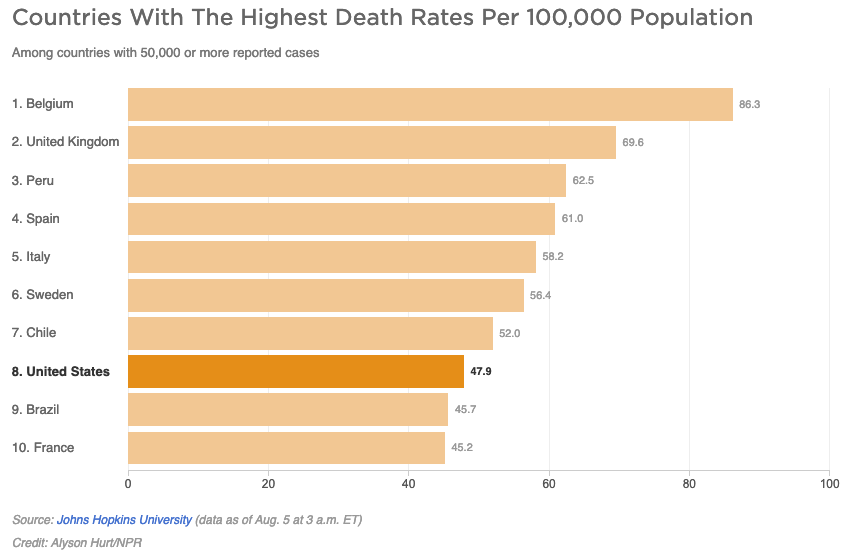
Swan countered by shifting the focus to per capita mortality—deaths relative to the total population—a standard metric used by epidemiologists to assess the broader impact of a disease on a society. The President’s dismissal of this metric, stating, "You can’t do that," prompted a national conversation about how mortality data should be interpreted. While both the case fatality ratio and per capita mortality offer valuable insights, their utility is entirely dependent on the context in which they are presented and the breadth of the data included in the visualization.
The Perils of Arbitrary Data Selection
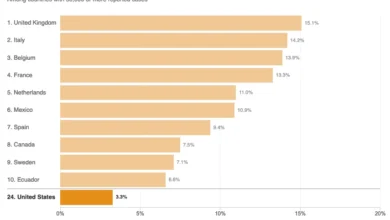
The NPR article sought to provide clarity to this debate through two specific charts comparing the U.S. to other countries with 50,000 or more reported cases. However, data analysts have noted that the presentation utilized a "top 10" methodology, which inherently distorts the global standing of the United States.
By limiting the scope of the charts to only ten countries, the visualizations created a truncated view of the pandemic’s global reach. As of August 5, 2020, there were 45 countries that had reported more than 50,000 cases. When the data is constrained to a top-ten list, the U.S. appears to be an outlier in a way that does not reflect its true position among the broader international community. In the per capita death chart, the limited view suggested that only Brazil and France were performing better than the U.S., when in reality, 37 of the 44 other nations with significant case counts were reporting lower per capita death rates.
This "curse of the top 10" is a recognized pitfall in data journalism. When visualizations are edited to highlight a small subset, they risk prioritizing aesthetic simplicity over comprehensive truth. For a reader, this presents a misleading narrative: if the goal is to assess performance, a full dataset is required to establish a meaningful baseline. By omitting the majority of the relevant countries, the charts failed to provide the context necessary to evaluate the U.S. response relative to its peers.
Epidemiology and the Definition of Disease Burden
The NPR report also included an assessment of "disease burden," citing experts from Johns Hopkins University. The article noted that per capita death rates are an indication of the "overall disease burden," defined in the text as "the impact of a particular disease in terms of years of life lost and years lived with disability."
Epidemiologists have pointed out that this characterization conflates distinct metrics. Per capita death rates measure the frequency of mortality within a population, which is a proportional indicator. "Overall disease burden," conversely, is more accurately represented by the aggregate impact on a nation, typically correlating with total case counts and the long-term health consequences of the pandemic. By applying a technical definition of "disease burden" to a per capita statistic, the report risked muddying the waters of public understanding, as the two measures serve fundamentally different diagnostic purposes in public health policy.
The Case Fatality Ratio vs. Per Capita Mortality
The second visualization presented in the report—the case fatality ratio (CFR)—further complicated the narrative. While the U.S. appeared to be performing well on this metric, ranking near the bottom of the provided list, the exclusion of the remaining 35 countries meant the reader was once again deprived of a full perspective. In the context of global health, the CFR is highly sensitive to testing volume; countries with limited testing capacity will naturally report higher fatality ratios because they are only capturing the most severe cases. Consequently, using the CFR as the sole metric to determine the success of a country’s pandemic response is statistically flawed without normalizing for testing density.
Broader Implications for News Reporting
The challenges faced by the NPR report are symptomatic of a broader struggle in media: the balance between simplifying complex data for a general audience and maintaining the rigor required for scientific accuracy. When news organizations attempt to be "even-handed," they sometimes fall into the trap of using data to support a narrative of balance rather than allowing the data to speak for itself.
The political climate of August 2020 placed immense pressure on journalists to fact-check the executive branch. However, the attempt to provide a "middle-ground" analysis by including positive spins on mortality statistics—or by relying on incomplete datasets—often undermines the goal of objective reporting. A factual analysis of the pandemic requires an unflinching look at all available data points, regardless of whether the results are politically convenient.
Moving Forward: Standards for Data Visualization
The incident serves as a critical case study for media outlets moving forward. To maintain public trust and foster an informed citizenry, data journalism must adhere to several core principles:
- Completeness: Data visualizations should include all relevant data points when a comparison is being made, rather than cherry-picking subsets.
- Contextual Transparency: Metrics such as CFR must be explained alongside their limitations, including how testing volume and demographic differences—such as the median age of a population—influence the results.
- Terminology Precision: Definitions of complex epidemiological terms must be used accurately to avoid misleading the audience regarding the scope of a health crisis.
- Resistance to Narrative Bias: Journalists must ensure that the design of a chart is not intended to bolster a specific "even-handed" narrative, but rather to reveal the underlying trends as clearly as possible.
Conclusion
The debate between the White House and the media in the summer of 2020 was not merely about politics; it was a fundamental conflict over how truth is constructed through statistics. While the NPR report was an attempt to provide clarity, it ultimately demonstrated that even well-intentioned media organizations can fail when they prioritize simplified visualizations over comprehensive data analysis. As society continues to navigate the complexities of global health crises, the responsibility of the press to present accurate, unvarnished data is more critical than ever. The lessons from this episode suggest that the most powerful tool for a journalist is not a persuasive chart, but a complete one. Ensuring that the public has access to the full spectrum of data is the only way to move past the rhetoric and achieve a genuine understanding of the challenges faced by nations on the global stage.