The Art and Science of Communicating Proportional Relationships in Data Analysis

In the realm of data sensemaking, the ability to accurately interpret and communicate quantitative relationships is paramount. While analysts frequently focus on distribution, correlation, and time-series trends, the concept of proportion—the comparative relationship between two quantities—remains the bedrock of meaningful insight. Despite its fundamental nature, the communication of proportions is a frequent source of public confusion, leading to misinterpretations that can skew policy debates, health statistics, and financial reporting.
The Mathematical Foundations of Proportion
At its core, a proportion is a simple relational comparison. Whether comparing the number of friends in a social network or the fiscal output of competing markets, a proportion is defined by how one value relates to another. However, the linguistic flexibility of English often obscures these relationships. Proportions are expressed in a variety of forms: ratios (20:10), fractions (20/10), rates (2), and percentages (200%).
The primary hurdle in communication is the choice of the reference point. When Sally has 20 friends and John has 10, stating that Sally has "twice as many" is mathematically equivalent to saying the ratio is 2:1 or the rate is 2.0. Confusion often enters the discourse when these values are translated into "greater than" or "less than" expressions. For example, saying Sally has "100% more" friends than John is technically correct in a specific context (the difference divided by the reference value), but it is cognitively taxing for audiences. When data communicators shift the reference point from John to Sally, the resulting rate drops to 0.5 (or 50%), a change that frequently leads to statistical errors in reporting.
A Case Study in Reporting Errors: The PBS Newshour Incident
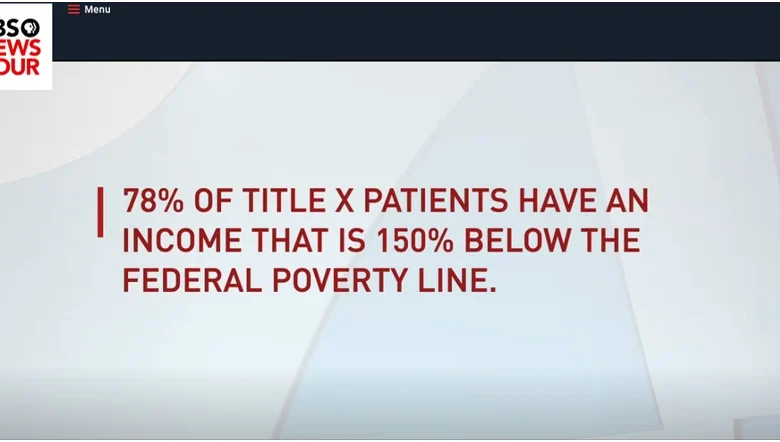
The danger of failing to define reference points became evident on September 23, 2019, during a PBS Newshour broadcast. The segment, titled "Judges weigh Trump’s family planning funding rule," featured a graphic displaying income levels of Title X patients. The on-screen text claimed that certain incomes were "150% below the poverty line."
From a mathematical standpoint, this statement is logically impossible. A value can be at most 100% below a baseline, as any value beyond that would result in a negative number, which is incompatible with income statistics. The error likely stemmed from a failure to distinguish between a "percentage increase" and a "percentage point" threshold. The intended meaning was almost certainly that 78% of Title X patients earned incomes falling below 150% of the federal poverty level. In 2019, with the federal poverty level for a single person set at $12,140, the 150% threshold amounted to $18,210. The lack of precise terminology in the broadcast serves as a cautionary tale regarding the necessity of clear, standardized reporting in public-facing media.
The Perils of Part-to-Whole Visualization
The importance of the 100% baseline is most apparent in part-to-whole relationships, where individual components must aggregate to a complete whole. While common, the pie chart is widely regarded by data visualization experts as an ineffective medium for this task. Because the human eye is notoriously poor at comparing the areas of circular slices, these charts often fail to convey the intended proportional significance of the data.
In business intelligence and public policy, where stakeholders must compare geographical regions or budget allocations, alternative displays—such as stacked bar charts or treemaps—are often superior. The persistence of the pie chart in corporate presentations is a classic example of aesthetic preference overriding functional communication, often to the detriment of the viewer’s ability to discern meaningful differences.
Parsing Changes: The Obesity Rate Challenge
Perhaps the most significant challenge in proportional communication involves describing changes over time. Consider a recent public health report stating that the obesity rate among U.S. adults is 42%, representing a 40% increase over the last two decades.
If an audience is not well-versed in the distinction between "percentage increase" and "percentage point increase," they may struggle to calculate the starting point. If the 40% figure refers to a percentage point increase, one might mistakenly calculate the year 2000 rate as 2% (42% – 40%). However, if the 40% represents a relative increase, the calculation requires dividing the current rate by the growth factor (42% / 1.4 = 30%).
The history of U.S. health data confirms the latter is the accurate interpretation, as an obesity rate of 2% in the year 2000 is historically inaccurate. To mitigate this confusion, reporting agencies are increasingly encouraged to provide explicit context. Phrases like "increased from 30% to 42%" are far more resilient to misinterpretation than relative growth percentages alone.
Implications for Data Literacy
The broader implications of these communication failures are profound. In an era of data-driven policy, the ability of the public and policymakers to grasp proportional relationships is a prerequisite for informed democratic participation. When media outlets or governmental bodies use ambiguous terminology, they invite skepticism and foster environments where misinformation can thrive.
For instance, in financial news, the confusion between a "10% increase in profit" and a "10 percentage point increase in profit margin" can lead to massive misallocations of capital by investors. The former describes a growth in total earnings, while the latter describes an expansion of efficiency. Despite the vast difference in economic meaning, the linguistic proximity of these terms makes them easy to conflate.
Best Practices for Clear Communication
To improve the standard of reporting, data analysts and journalists should adhere to three primary principles:
- Define the Reference Point: Always clarify what is being used as the baseline. Instead of saying "a 50% decrease," specify "a decrease from 20 units to 10 units."
- Avoid "Greater Than/Less Than" Ambiguity: When expressing differences, explicitly state the values being compared to avoid the "150% below" trap.
- Use Percentage Points for Rates: When discussing changes in percentages, clarify if the shift is a relative growth (a percentage of the percentage) or an absolute shift (a change in percentage points).
Conclusion
The discipline of data sensemaking is not merely about finding the correct number; it is about ensuring that the number conveys the intended reality. As demonstrated by the errors found in major news broadcasts and the persistent reliance on flawed visualization techniques like the pie chart, the gap between data collection and public understanding remains wide. Bridging this gap requires a shift in focus from the data itself to the language used to translate that data for the general public. By prioritizing clarity over complexity and context over convenience, communicators can ensure that the quantitative truths they present are not only accurate but also actionable. As the volume of data continues to grow, the responsibility to report it with precision becomes not just a professional obligation, but a public necessity.
Related posts: