Demystifying the Logarithm: Understanding Mathematical Scales and Growth Patterns in Data Analysis

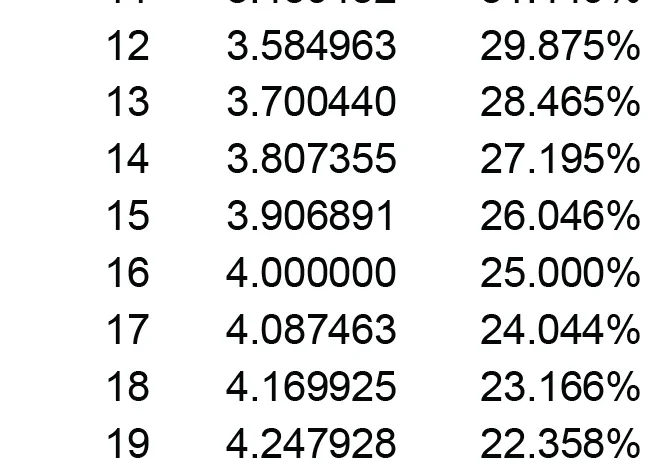
For data professionals and analysts, the ability to interpret complex numerical relationships is a fundamental requirement, yet certain mathematical concepts—specifically logarithms, logarithmic scales, and logarithmic growth—remain sources of persistent confusion. Often misunderstood as mere academic abstractions, these concepts are essential tools for visualizing phenomena that span several orders of magnitude. The historical struggle to grasp these principles frequently stems from limited formal training in mathematics, a common experience among practitioners who enter the data field through interdisciplinary pathways rather than through pure mathematics or physics.

The Mathematical Foundation of Logarithms
A logarithm, fundamentally, is the inverse operation of exponentiation. If exponentiation asks, "What is the result of multiplying a base by itself a specific number of times?", the logarithm asks, "To what power must a base be raised to reach a specific number?" For instance, in the base-10 system, the number 100 is expressed as 10 raised to the power of 2 (10² = 100). Consequently, the base-10 logarithm (log₁₀) of 100 is 2.
The historical utility of logarithms dates back to the 17th century, when mathematician John Napier introduced them to simplify complex astronomical calculations. By converting multiplication and division into addition and subtraction, logarithms transformed the landscape of scientific computation. Today, this principle remains the bedrock of logarithmic scales, which are designed to represent data that spans a vast range of values, such as earthquake magnitudes (the Richter scale) or sound intensity (decibels).

The Evolution of Data Visualization and Logarithmic Scaling
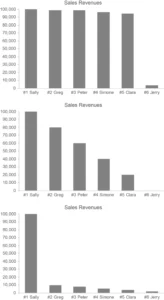
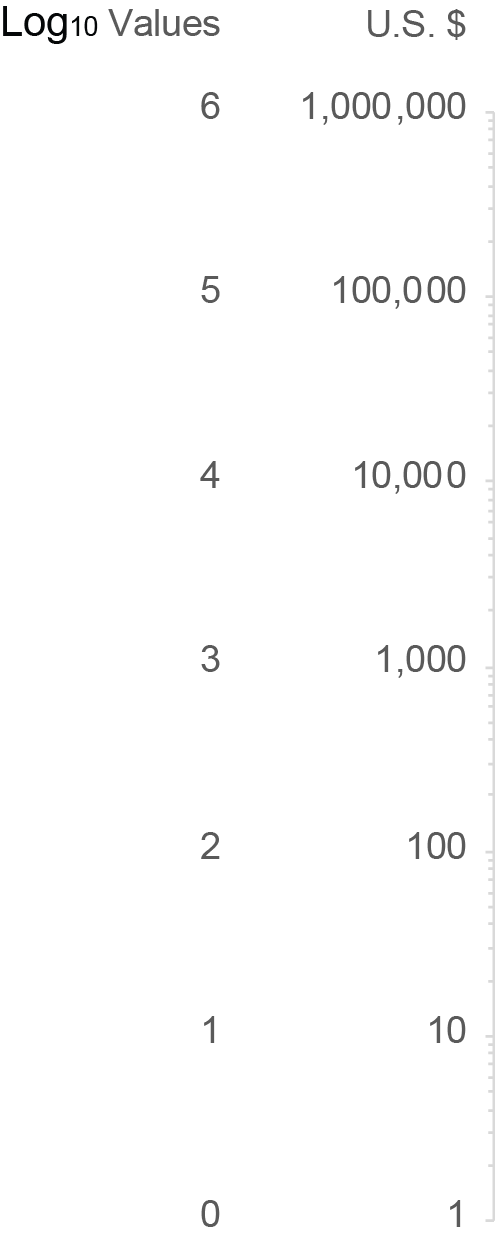
In modern data sensemaking, the distinction between a linear scale and a logarithmic scale is critical. On a linear scale, equal physical distances represent equal absolute values—for example, the distance between 10 and 20 is identical to the distance between 1,000 and 1,010. On a logarithmic scale, however, equal distances represent equal proportional changes. This allows analysts to visualize trends in data that would otherwise be obscured by extreme outliers.
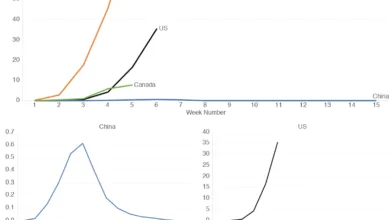
Chronologically, the formalization of logarithmic graphing in professional data visualization began to gain prominence in the late 20th century as computing power allowed for more dynamic plotting of Big Data. In a standard logarithmic plot, each major interval (a "cycle") represents a power of the base. If the base is 10, the ticks might represent 1, 10, 100, 1,000, and so on. This architecture is vital for fields such as epidemiology, where the initial spread of a pathogen often follows an exponential trajectory, or finance, where compound interest requires a proportional view of capital growth.

Logarithmic Growth vs. Exponential Growth
A significant point of confusion for many analysts is the conflation of "logarithmic growth" with "exponential growth." These two concepts are mathematical opposites.
Exponential growth, often described as "compound growth," occurs when a value increases by a consistent percentage over fixed intervals. If a business grows its revenue by 10% annually, the absolute dollar amount of that growth increases every year because the base figure for the next calculation is larger. Over time, this creates a curve that steepens rapidly, often leading to what is colloquially known as a "hockey stick" chart.
Conversely, logarithmic growth is characterized by rapid initial increases that progressively taper off over time. A common physical analogy is the trajectory of an object moving against a resistive force, such as a projectile losing speed due to air resistance or the velocity of an object reaching a terminal state. In data terms, logarithmic growth represents a system where the rate of change is inversely proportional to the current value. As the value increases, the marginal gain decreases, creating a curve that flattens out as it approaches its limit.
Comparative Data Analysis: The Impact on Interpretation
The implications for data analysts are significant. When an analyst plots an exponential trend on a linear scale, the curve becomes unreadable as it approaches high values. By switching the axis to a logarithmic scale, the exponential curve is "linearized," making it far easier to compare growth rates across different time periods.

- Linear Scale: Best for displaying absolute differences and identifying small, steady changes.
- Logarithmic Scale: Best for comparing growth rates, identifying cycles, and managing data sets that vary across several orders of magnitude.
If an analyst mistakenly interprets a linear trend as logarithmic, they may fail to identify the true nature of the underlying data. For instance, in financial risk modeling, failing to recognize that a portfolio is growing exponentially—rather than logarithmically—could lead to a severe underestimation of potential volatility or market impact.
Expert Consensus and Professional Standards
Leading statisticians and data scientists emphasize that the misuse of log scales is a common error in business intelligence reporting. A 2020 white paper on data visualization standards noted that "the primary failure in reporting is the lack of context regarding the Y-axis." When a chart uses a logarithmic scale without explicit labeling or an explanation for the audience, it can mislead stakeholders into believing that a massive absolute increase is smaller than it truly is, or vice-versa.
From a professional standpoint, transparency is paramount. Analysts are encouraged to:
- Clearly label axes: If a log scale is used, the axis must be explicitly labeled as such.
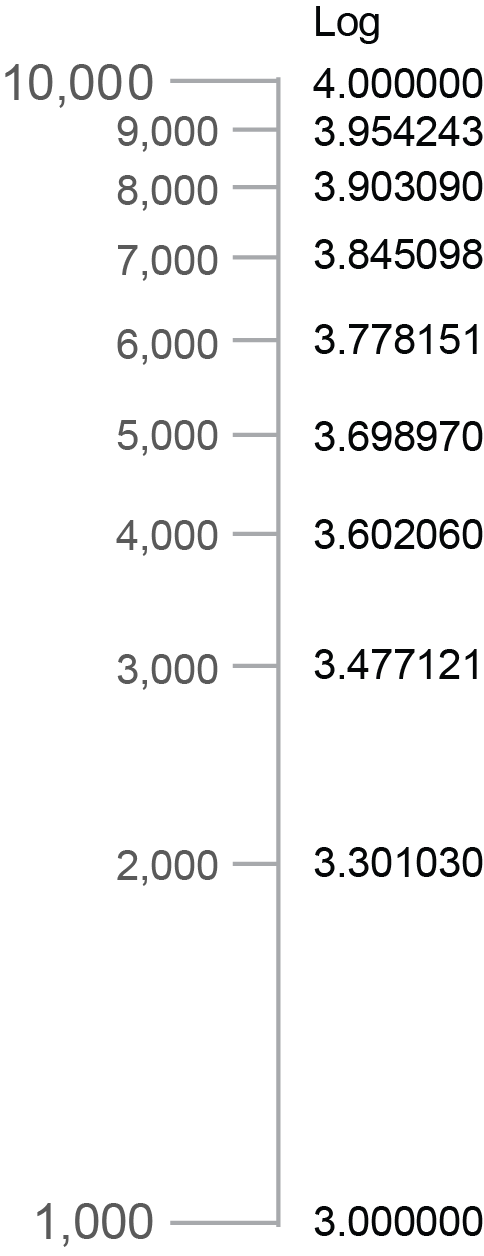
- Use gridlines effectively: Ensure that minor tick marks reflect the non-linear nature of the intervals.
- Provide context: If the data involves growth rates, clarify whether the metric being presented is the raw value or the log-transformed value.
Broader Implications for Analytics
The ability to distinguish between these growth patterns is more than an academic exercise; it is a fundamental requirement for informed decision-making. As the volume of data generated by global enterprises continues to grow, the reliance on log-based visualization will only increase. By understanding that logarithms are not just a way to condense large numbers, but a way to represent the proportional nature of change, professionals can avoid common pitfalls in data interpretation.

Looking ahead, as artificial intelligence and machine learning models are trained on increasingly large datasets, the preprocessing step of "log transformation" will continue to be a standard technique. This process stabilizes the variance of data, ensuring that models are not overly biased by large-magnitude outliers. Whether one is evaluating public health statistics, stock market trends, or user engagement metrics, the mastery of logarithmic concepts is essential for turning raw, complex information into actionable intelligence. By cutting through the confusion surrounding these concepts, data professionals can ensure that their visualizations accurately represent the reality of the trends they are tasked to communicate, ultimately fostering a more data-literate environment within their organizations.
Related posts: