The Peril of Premature Conclusions: Why Daily COVID-19 Statistics Require Caution and Context


The COVID-19 pandemic has fundamentally transformed the way the general public interacts with statistical data. As governments and health organizations scramble to track the spread of the virus, the daily release of case counts has become a focal point for media outlets, financial markets, and policymakers. However, a closer examination of how these numbers are collected, analyzed, and reported reveals that relying on day-to-day fluctuations can lead to dangerous misinterpretations of the pandemic’s actual trajectory.
The Financial Markets and the Illusion of Progress
In early April 2020, the relationship between epidemiological data and market volatility became strikingly evident. On April 6, 2020, the Dow Jones Industrial Average surged by 1,627.46 points—a 7.73% increase—following reports that new COVID-19 case counts had slowed. The optimism was fueled by a report from Investor’s Business Daily, which highlighted that U.S. coronavirus cases had jumped by 25,316 on April 5, marking a decline from the record 34,196 cases reported on April 4.

This drop was interpreted by many as the first significant sign of a deceleration in the virus’s spread since mid-March. Consequently, financial markets responded with a rally, driven by the hope that the United States had finally "turned the corner." Yet, such reactions highlight a systemic issue: the tendency of both investors and the public to treat volatile, daily data as a definitive indicator of long-term trends. By assigning profound economic meaning to a single day’s data point, market participants risk ignoring the inherent "noise" and reporting delays that characterize public health data during a crisis.
The Anatomy of Reporting Delays and Statistical Noise
To understand why daily figures are often misleading, one must look at the mechanics of disease surveillance. Data regarding new cases does not represent the day an individual was infected; rather, it reflects the date that a laboratory result was processed and entered into a national reporting system. This creates a significant temporal disconnect.
There are several layers of latency in the data pipeline. First, there is the incubation period of the virus, which can last up to 14 days, meaning that a reported case today may be the result of an infection that occurred nearly two weeks prior. Second, there is the delay between symptom onset and the decision to seek medical care. Third, there is the administrative bottleneck: the time required for a test to be performed, the sample to be analyzed by a laboratory, and the result to be officially recorded by local health departments and transmitted to the Centers for Disease Control and Prevention (CDC).

When these individual delays are aggregated across millions of people, the resulting daily count is susceptible to massive fluctuations. Weekend reporting lags, staffing shortages at health departments, and batch processing of laboratory results can all create artificial "dips" or "spikes" that have no basis in the actual viral transmission rate.
Analyzing the Data: Why Moving Averages Matter
In contrast to the raw daily counts, epidemiologists and data scientists prefer to use "moving averages" to identify true trends. A 5-day or 7-day moving average smooths out the daily volatility by averaging the current day’s report with those of the preceding days. This technique effectively filters out the "noise"—the weekend dips and the catch-up reporting spikes—to reveal a clearer picture of the pandemic’s momentum.
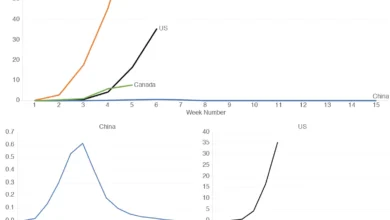
When the data from early April 2020 is plotted as a 5-day moving average, the "dramatic" decline observed on April 5th largely vanishes. Instead of a sharp, encouraging drop, the smoothed data shows a more persistent, upward trajectory. This observation is crucial: it suggests that while the rate of growth may have slowed, the pandemic was far from being contained. By looking only at the daily peaks and troughs, the public is essentially trying to read a signal through a blizzard of interference.

A Chronology of Uncertainty
The early weeks of April 2020 served as a masterclass in the dangers of observational bias.
- April 3, 2020: Data reflected a sharp rise in new cases, prompting widespread alarm.
- April 4, 2020: Reported cases reached a record high, leading to intense media coverage and public anxiety.
- April 5, 2020: A reported decline in new cases occurred, triggering immediate market optimism.
- April 6, 2020: The inclusion of new data for April 6th demonstrated that the "decline" observed the previous day was likely a statistical anomaly, as the overall upward trend resumed.
This sequence demonstrates that waiting even 24 to 48 hours to incorporate new data often paints a significantly different picture. The "peak" that market analysts thought they saw on April 5th was not a turning point; it was merely a temporary fluctuation within a broader, ongoing surge.
The Broader Impact: Implications for Policy and Public Health
The reliance on incomplete or misinterpreted data has profound implications for public policy. If government officials make decisions—such as reopening schools or lifting stay-at-home orders—based on a "good" day of data that is actually just a reporting artifact, the results could be catastrophic.

Furthermore, the lack of universal testing capacity in the early stages of the pandemic meant that the official case counts were never a true reflection of the actual number of infections. Many cases remained asymptomatic or mild, with those individuals never seeking testing. Consequently, the official count was only a proxy, and a flawed one at that. As medical professionals became increasingly overtaxed, the likelihood of reporting errors and data delays grew, further compromising the integrity of the daily dashboard.
Conclusion: The Necessity of Statistical Patience
The lesson to be drawn from the events of April 2020 is one of humility. The statistical models deployed by researchers are, by necessity, educated guesses based on incomplete datasets. The "true" trajectory of a pandemic is only visible in hindsight, after the dust has settled and the data has been cleaned and reconciled.
For the general public, the media, and financial analysts, the imperative is to practice patience. Relying on hasty conclusions drawn from a single day’s data—whether that data suggests an imminent end to the crisis or a deepening disaster—serves no one. By shifting the focus from daily spikes to longer-term trends and acknowledging the limitations of our reporting infrastructure, we can make more informed decisions. In a crisis of this magnitude, our greatest tool is not the speed of our reaction, but the accuracy and context of our understanding. True situational awareness will only be gained through time, careful analysis, and a commitment to looking past the volatility of the daily report.
Related posts: