A revolutionary class of artificial intelligence models, colloquially termed "tabular LLMs," is rapidly reshaping the landscape of data analysis. These pretrained transformer models possess the unprecedented ability to predict missing values in any tabular dataset with remarkable accuracy, performing this task in a "zero-shot" manner, akin to how a language model completes a sentence. This development marks a significant departure from traditional methods, with leading community benchmarks now showcasing these tabular foundation models consistently outperforming even the most finely-tuned gradient-boosted tree (GBDT) ensembles. This article delves into the nature of these advanced models, rigorously verifies the performance of a leading contender, and delineates the remaining niches where traditional tree-based methods still hold an advantage.
The current state of tabular data analysis, as reflected in prominent benchmarks like TabArena, indicates a paradigm shift. For over a decade, the default answer for complex tabular prediction tasks was a meticulously tuned and often ensembled gradient-boosted tree. However, the emergence of tabular foundation models has fundamentally inverted this long-standing convention. On the TabArena leaderboard, virtually every single-model entry that surpasses the performance of the best tuned GBDT configuration is now a tabular foundation model. The only exceptions are sophisticated ensemble pipelines, such as those developed by AutoGluon, which require extensive computational resources and time.
This dramatic shift prompted a thorough investigation to ensure the validity of these benchmark results. Historical instances of leaderboards being misleading, particularly when re-evaluated by independent parties, necessitate such scrutiny. This investigation involved a comprehensive re-computation of the benchmark’s scoring using its published artifacts, followed by an independent verification of TabICLv2, identified as the strongest model with unrestricted open weights. This verification was conducted on the author’s own hardware, providing an unbiased assessment of its capabilities.
The independent evaluation encompassed all 51 datasets within the TabArena benchmark’s official "Lite" protocol. This protocol utilizes a single train/test split for each dataset, mirroring the splits employed by the leaderboard. The entire evaluation was executed on a single AWS A10G instance. The results of this independent run demonstrated a high degree of consistency with the official benchmark scores. TabICLv2 achieved an Elo rating of 1559 in the author’s run, closely trailing the official benchmark’s 1575. These rankings are adjacent, and the slight discrepancy falls well within the expected statistical variance (±60-86 bootstrap intervals). On a per-task basis, 16 out of 51 metric values were identical to the official scores down to four decimal places. The median relative difference across all tasks was a mere 0.08%, with the most significant deviation on any single dataset being 3.5%. This level of variance is typical of minor GPU nondeterminism rather than fundamental methodological differences. Furthermore, the entire experimental sweep, including environment setup, was completed within a 2.1-hour GPU session, incurring a cost of just over $2.
Understanding Tabular Foundation Models
At their core, tabular foundation models represent a novel category of AI designed to operate on tabular data. Unlike specialized models trained for specific datasets, these are single, pretrained models capable of making predictions on any table, without requiring any dataset-specific fine-tuning – the hallmark of "zero-shot" learning. The user provides a small set of labeled examples from the table as context, analogous to providing examples in a text-based LLM prompt. The model then uses this context to predict the labels for unseen rows in a single forward pass. This process bypasses the traditional "training" phase, where models are gradient-trained on specific data and hyperparameters are searched. Instead, what was once training is now inference. This technique is known as "in-context learning," and its efficacy for tabular data was first established in research papers concerning TabPFN.
The operational mechanism of these models can be understood as a sophisticated form of learned k-nearest neighbors. When tasked with labeling a new, unlabeled row, the model analyzes the provided labeled rows. It identifies similarities between the unlabeled row and the labeled ones, and then extrapolates an answer weighted by the degree of similarity. The key differentiator from traditional k-NN lies in the fact that the similarity metric and the method of combining neighbor information are learned during the pretraining phase, rather than being fixed a priori.
The field has witnessed rapid advancements since the initial work on TabPFN. Successors include models from Prior Labs, Inria’s SODA team (TabICL and TabICLv2), Layer 6 (TabDPT), and most recently, Google Research’s TabFM, which was released shortly before this article’s publication. All these models are now represented on the TabArena leaderboard.
The term "tabular LLM" is applied loosely, as these models, while based on transformer architectures, do not process natural language. Their underlying components and objectives differ significantly from text-based LLMs. A text LLM operates on word-pieces from a fixed vocabulary. In contrast, tabular models process the raw cells, columns, and rows of a table, which can contain numbers and categories without any predefined vocabulary. The model must adapt to unseen column names and data types. Text LLMs are pretrained on vast amounts of internet text using a next-token prediction objective. Tabular foundation models, conversely, are pretrained on millions of synthetic tables generated from random structural causal models (SCMs). Their pretraining objective is to predict missing cells and labels within these synthetic tables. This pretraining instills a generalized procedure for interpreting fresh tables and inferring feature relationships to a target variable, rather than imparting world knowledge.

A notable consequence of this approach is model size. Tables, by their nature, tend to exhibit less surface complexity than natural language. Consequently, tabular foundation models often require significantly fewer parameters. For instance, TabICLv2 comprises approximately 28 million parameters, a fraction of the 102 million parameters in t0-alpha (a time-series model) and vastly fewer than the billions found in typical text LLMs.
The distinction between tabular foundation models and time-series foundation models (such as t0, Chronos, and TimesFM) lies in their handling of order. Time-series data possesses a natural sequential order, and models like t0 employ causal attention mechanisms to process data chronologically, forecasting by extending the observed sequence. Tables, however, lack inherent row order; shuffling rows does not alter the table’s fundamental meaning. Therefore, tabular models require architectures where predictions are invariant to row order. While column order is also arbitrary, TabICLv2 employs techniques like rotary embeddings and feature grouping to maintain distinct column identities. The primary task for tabular models shifts from extrapolating future sequences to predicting a missing column for held-out rows. Despite these architectural differences, both fields have converged on similar training methodologies: pretraining on synthetic data (universally for tabular models, partially for time-series) and emitting predictive distributions rather than single point estimates. For example, t0 outputs nine quantiles, while TabICLv2’s regression head provides 999 quantiles.
It is important to distinguish between table-native foundation models and approaches that serialize tables into text and then process them with a standard text LLM. The latter, exemplified by TabLLM, was also evaluated in this audit. The findings indicate that table-native models significantly outperform this serialization approach, losing on 43 out of 49 datasets.
Unpacking TabICLv2: Compact, Open, and Reproducible
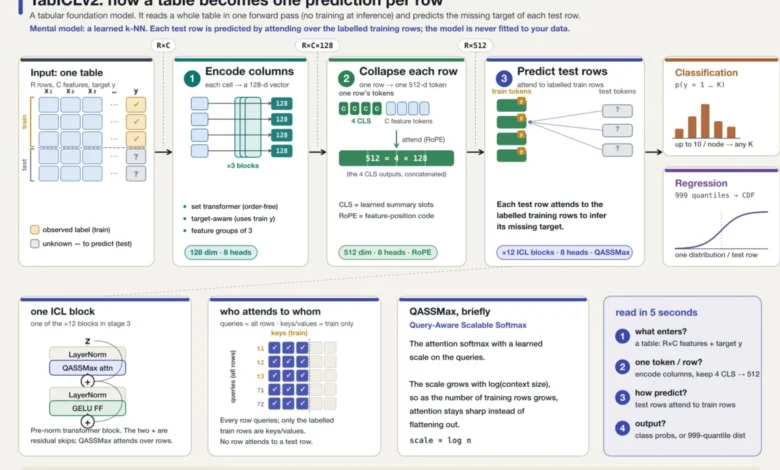
TabICLv2 stands out as a prime example of these advanced in-context learning models. Its "fitting" process, which involves no gradient descent, takes mere seconds, and it requires no hyperparameter tuning. Architecturally, it comprises three stacked transformers, each addressing a distinct analytical task.
The first transformer operates column by column. Its primary function is to convert raw data values into embeddings that capture the nature of the data within that specific column. For instance, the number ‘450’ would have a different semantic meaning in a ‘price’ column compared to a ‘postcode’ column. This stage utilizes a set transformer, treating each column as an unordered set of values. It learns the distribution of values within a feature and assigns each cell an embedding that reflects its position within that distribution. Thus, ‘450’ might be interpreted as "a relatively inexpensive item" in a price column and "a specific area code" in a postcode column, despite being the same numerical input.
The second transformer processes each row, consolidating it into a single vector representation. After the initial column-wise embedding, a row can be viewed as a collection of per-feature embeddings. To summarize this collection, a transformer employs learned query tokens (similar to [CLS] tokens in BERT) that attend to the row’s constituent parts. In TabICLv2, four such query tokens per row aggregate the salient information, and their outputs are concatenated to form a fixed-length vector representation of the entire row, regardless of the original number of columns.
The third transformer is where the in-context learning takes place, directly producing predictions. At prediction time, no gradient descent is performed. Instead, the vector representations of unlabeled test rows attend to the vector representations of labeled training rows. The model identifies training rows that are most similar to the test rows and derives predictions from them. This attention mechanism is unidirectional, flowing from test rows to train rows, ensuring that labeled examples inform predictions without being altered themselves. This process is analogous to nearest-neighbors reasoning, executed via attention, where the model weighs known examples by their similarity to the current input and predicts accordingly. The training set serves as contextual information rather than being embedded in the model’s weights, enabling predictions on unseen tables without any retraining.
Two distinct heads are attached to this transformer: one for classification tasks and another for regression. The classification head employs a hierarchical classifier capable of handling any number of classes. The regression head, rather than outputting a single point estimate, generates a distribution by predicting 999 quantiles, ranging from the 0.1st to the 99.9th percentile. This comprehensive predictive distribution allows for the calculation of medians and robust confidence intervals.
The regression head’s quantile prediction is trained using "pinball loss." This loss function penalizes under-prediction and over-prediction differently, depending on the target quantile. For instance, when predicting the 90th percentile, under-shooting the true value incurs a penalty of 0.9 times the error, while over-shooting incurs only a 0.1 times error. This asymmetry incentivizes the model to predict a value such that approximately 90% of the true values fall below it, effectively defining the 90th percentile. When applied to all 999 quantiles simultaneously, each output converges to its respective position within the predictive distribution. The name "pinball loss" derives from the shape of the loss function plotted against error, resembling a lopsided ‘V’. At the median, the loss is symmetric and reduces to mean absolute error.

Key architectural innovations enabling TabICLv2’s scalability over its predecessor, TabICLv1, include a query-aware rescaled softmax (QASSMax) to prevent attention decay over long contexts, feature grouping to disambiguate columns, and early injection of target embeddings.
The selection of TabICLv2 as an audit target was driven by three critical properties: its compact size, its open-source nature, and its reproducibility. The model’s weights are publicly available on HuggingFace under a permissive BSD-3 license, requiring no gating or click-through agreements. Installation is as simple as pip install tabicl. The model’s parameter count, approximately 28 million for the regressor and 27.6 million for the classifier, is roughly a quarter of t0-alpha’s size, yet it consistently outperforms finely tuned GBDTs. In contrast, competing models like TabPFN from Prior Labs have weights licensed for non-commercial use with a mandatory license acceptance step. Google Research’s TabFM, while achieving top performance, was released with weights under a non-commercial license and notably, without an accompanying technical paper detailing its architecture or parameter count. The availability of open weights is crucial for independent verification, empowering anyone to reproduce the evaluation results.
Furthermore, TabICLv2 is pretrained exclusively on synthetic data generated from random structural causal models. This ensures that no real-world tabular datasets were included in its pretraining corpus, thereby eliminating the possibility of benchmark contamination. This clean data provenance offers a significant advantage in terms of trustworthiness.
Deploying Tabular Foundation Models: A Practical Guide
For practitioners, integrating TabICLv2 into their workflows is streamlined through a scikit-learn-compatible interface. After installation via pip install tabicl, the model automatically downloads its checkpoint from HuggingFace on its first use. It accepts pandas DataFrames, handling categorical columns and missing values natively.
from tabicl import TabICLClassifier # Use TabICLRegressor for regression tasks

# Initialize the classifier (defaults are suitable, no hyperparameter search needed)
clf = TabICLClassifier()

# Fit the model – this is a fast in-context learning step, not traditional training
clf.fit(X_train, y_train)

# Predict probabilities for new data
proba = clf.predict_proba(X_test)
While TabICLv2 can operate on CPUs for smaller datasets, its performance is optimized for GPUs. The speed metrics presented in this analysis are based on GPU execution, with consumer-grade GPUs being the intended deployment hardware. The model’s performance envelope is defined by its pretraining data: tables ranging from approximately 300 to 48,000 training rows. The benchmark datasets extend up to 150,000 rows. Analysis indicates that accuracy may degrade on very wide tables (exceeding roughly 100 features). Within these parameters, TabICLv2 consistently wins against tuned trees in 86-88% of datasets, with fitting times measured in seconds. For datasets that fall outside these optimal conditions, traditional tuned GBDT models remain a viable alternative.
The TabArena Benchmark: Rigorous Evaluation and Independent Verification
TabArena serves as a comprehensive benchmark, featuring 51 curated datasets that span binary classification, multiclass classification, and regression tasks. These datasets vary in size, from 748 to 150,000 rows and 5 to 1,777 features. Each method’s performance is assessed through repeated cross-validation, with 9 to 30 splits per dataset. Task-appropriate metrics such as ROC-AUC, log-loss, and RMSE are employed. The aggregate performance is measured using an Elo rating system, where each pairwise comparison on a task constitutes a "game." A default RandomForest classifier is anchored at 1000 Elo, with a 400-point difference indicating approximately a 10:1 win probability. TabArena is a dynamic benchmark, with new methods and results continuously being added.
To ensure the integrity of the benchmark’s findings, a crucial step was to independently recompute the Elo ratings. TabArena provides downloadable artifacts containing per-split results, allowing for local aggregation. Using the benchmark’s official constants (200 bootstrap rounds, exclusion of imputed methods), the author’s locally aggregated board was compared against the data underlying the TabArena website. All 69 methods matched with remarkable precision, with 67 of them differing by no more than ±1 Elo point. The ordering of the top 30 methods remained identical, exhibiting a Spearman correlation of 0.99998. This verification process validates the benchmark’s scoring and aggregation code, analogous to the role played by a Seasonal-Naive baseline in time-series model evaluations. However, this does not validate the predictive accuracy of any individual model; that requires independent model re-runs.
Minor discrepancies were observed for tuned TabM configurations, which showed shifts of +4 and +5 Elo. These shifts were attributed to updates in TabM’s results artifacts occurring after the current website snapshot was published. Given the dynamic nature of the benchmark, all subsequent analyses are pinned to the snapshot dated 2026-07-15.
The recomputation also highlighted the pool-dependent nature of Elo ratings. An initial attempt that included imputed methods (excluded by the website) resulted in shifts of 10-30 Elo points across all ratings. The per-dataset metrics within the artifacts are pool-independent, while Elo provides a relative measure within a specific evaluation pool.

The TabArena Standings: A New Hierarchy Emerges
All Elo figures presented below are derived from the official TabArena leaderboard snapshot of 2026-07-15, which has been independently recomputed to within ±1 Elo from its published artifacts. These figures represent full-protocol numbers (9-30 splits per dataset). The author’s own independent run, using the Lite protocol (1 split per dataset), is presented separately as a comparative analysis.
Figure 3: TabArena Elo by Model, Sorted
(Image description: A bar chart showing Elo ratings for various models on the TabArena leaderboard. The dashed line represents the RandomForest anchor at 1000 Elo. TabICLv2 is highlighted in blue. The chart clearly shows foundation models dominating the top positions above the GBDT family.)
Source: Image by author.
Merging the author’s Lite protocol run with the full pool of TabArena Lite splits, the official TabICLv2 achieved an Elo of 1575, while the author’s independent run yielded 1559. Both results place them in adjacent ranks (5th and 6th, respectively) on the same leaderboard. The detailed per-task numbers are available in the reproduction section of the original analysis.
A key observation from the standings is that every single model positioned above the best tuned and ensembled GBDT configuration is a tabular foundation model. The only non-foundation model entries surpassing this threshold are the sophisticated AutoGluon ensemble pipelines. For context, LightGBM, when subjected to full tuning and post-hoc ensembling, achieves an Elo of 1432. TabICLv2, without any tuning, sits a remarkable 158 Elo points above this benchmark, with gated TabPFN models scoring even higher. On this specific board, for datasets within the size range of 748 to 150,000 rows, tabular foundation models unequivocally define the accuracy frontier, and the margin of superiority is substantial, exceeding initial expectations.
The performance advantage of foundation models is further contextualized when considering serving costs. A common defense of traditional tree-based models is their computational efficiency. However, TabICLv2 exhibits a median prediction time of 0.38 seconds per 1,000 rows, significantly outperforming tuned and ensembled LightGBM (2.64 seconds) and operating in a similar range to tuned CatBoost. Its median fitting time is approximately 4 seconds per 1,000 rows, which is roughly 100 times faster than the protocols for tuned GBDTs, owing to its single forward pass inference. It is important to note that foundation models typically leverage GPUs, while trees often run on CPUs. Therefore, a direct dollar-per-row comparison is infrastructure-dependent. Nevertheless, default CatBoost, running at 0.08 seconds per 1,000 rows on a CPU, remains a highly cost-effective option. For perspective, the author’s entire 51-dataset TabICLv2 evaluation, executed on an on-demand A10G GPU, cost approximately $2.
At the pinnacle of the leaderboard sits TabFM, a model developed by Google Research. It leads the next entry (an AutoGluon pipeline) by 98 Elo points and the next single model by 123 Elo points. TabFM was added to the board just two weeks prior to this article’s writing. While its pretraining methodology is entirely synthetic, drawing from structural causal model priors similar to TabPFN and TabICL, thus ruling out benchmark contamination by design, it lacks a published technical report. The accompanying weights carry a non-commercial license that is not explicitly detailed in the README. Despite these documentation and licensing ambiguities, independent re-tests have consistently placed TabFM ahead of tuned XGBoost. While its numbers are reported here, its status as "not independently run" is noted. The substantial Elo gap suggests its performance is indeed significant, but a definitive explanation for its efficacy remains elusive without further transparency from its developers.
The "Serialize-and-Prompt" Approach: A Measured Comparison
To provide a comprehensive comparison, the effectiveness of the "serialize-and-prompt" strategy – where tabular data is converted into text and processed by a large language model – was also evaluated. Claude Opus 4.8 was used for this experiment. Each dataset was presented as text, accompanied by 64 labeled example rows within the prompt. Batches of test rows were then provided for prediction, with requests for per-class probabilities as structured output. To manage costs, this evaluation used a reduced protocol: 50 subsampled test rows per dataset, a maximum of 32 columns displayed, and a single batched API run across all 51 datasets. The subsampling introduces noise into per-dataset scores, making aggregate results more informative.

The aggregate results revealed a stark contrast. Out of 51 datasets, two yielded too few usable predictions to be scored. On the remaining 49, the LLM outperformed TabICLv2 on only 6 datasets and the best tuned GBDT on the same 6. Crucially, the median error of the LLM was 57% higher than that of TabICLv2. The LLM showed an advantage on datasets where column names carry strong real-world semantic meaning, such as churn prediction, credit risk, and blood donation tables, where its language understanding could be leveraged. However, it performed poorly on datasets composed of pure patterns, like app permission vectors, sensor data, and physical process data, where its language prior offered no discernible benefit. The term "tabular LLM" can be misleading, conflating these two distinct modeling classes. In this evaluation, the 28 million parameter table-native TabICLv2 model won on 43 out of 49 datasets. Furthermore, TabICLv2 serves thousands of rows in a fraction of a GPU second, whereas the prompted LLM incurred a cost of approximately $1.50 per thousand predictions.
The Impact of Tuning on Gradient-Boosted Trees
A frequent counterargument from proponents of GBDTs is that the benchmark’s representation of trees is unfair, as default configurations are rarely used in practice. TabArena addresses this by evaluating GBDT models across three computational budgets: default configurations, extensively tuned models (requiring hours of compute), and tuned models combined with post-hoc ensembling.
(Image description: A chart comparing the Elo ratings of default, tuned, and tuned+ensembled GBDT models across different algorithms like LightGBM, XGBoost, and CatBoost. The chart visually demonstrates the significant performance gains from tuning and ensembling.)
The results clearly indicate that tuning provides a substantial performance boost for LightGBM and XGBoost, often on the order of 200 Elo points. This gain accounts for most of the difference between mid-tier and top-tier tree-based models. CatBoost emerges as an exception, with its default configurations performing within 47 Elo points of its fully tuned and ensembled counterpart. This aligns with CatBoost’s reputation for strong default performance, making it the most potent low-cost baseline on the board, achieving an Elo of 1370 on a CPU with a serving speed of 0.08 seconds per 1,000 rows.
Therefore, even when GBDTs are given their full tuning and ensembling budget, the untuned tabular foundation model, TabICLv2, maintains a lead of over 150 Elo points. This is a stark contrast to findings in time-series analysis, where proper tuning of GBDTs significantly narrowed the performance gap with foundation models.
While the aggregate Elo scores present a compelling narrative, a deeper analysis reveals a nuanced "regime split" where traditional tree models might still be preferred. Comparing TabICLv2 against the best tuned and ensembled GBDT across individual datasets, TabICLv2 prevails in 40 out of 51 cases. The eleven datasets where TabICLv2 falters cluster into two main categories.
The first category is dimensionality. Of the six datasets featuring more than 100 features, TabICLv2 wins only one. Datasets like Bioresponse (1,776 features), hiva_agnostic (1,617 features), QSAR-TID-11 (1,024 features), kddcup09 (212 features), and MIC (111 features) all exhibit superior performance with tree-based models. Below the 100-feature threshold, TabICLv2 consistently wins 86-88% of datasets.
The second category involves scale combined with high-cardinality categorical features. The most significant win for trees on the entire board is observed in the Amazon_employee_access dataset (a 25% error gap), a classic example of this data structure. Furthermore, TabICLv2’s win rate decreases from 89% on datasets with fewer than 3,000 rows to 64% on datasets exceeding 20,000 rows. Task type (binary, multiclass, or regression) appears to have a minor impact, with win rates ranging from 77-85%. While these six datasets represent a limited sample size for generalization, the dimensionality finding strongly suggests that for wide tables or those with highly complex categorical features, tuned GBDTs remain the primary choice.
Contamination Concerns: Clean Provenance Models Lagging Behind
Benchmark contamination has emerged as a critical issue in AI research, and it is particularly relevant in the context of tabular foundation models. The models with the cleanest data provenance are currently being outscored by those with less transparent training data practices.

TabICLv2 and the original TabPFN models are pretrained exclusively on synthetic data. This inherently clean provenance means that no benchmark dataset could have been present in their pretraining corpora, thus ruling out contamination by construction.
The impetus for this discussion arises from the observation that accuracy gains are increasingly being achieved by incorporating real-world data into pretraining. RealTabPFN-2.5, for instance, continues pretraining on "a curated corpus of 43 real-world tabular datasets sourced from OpenML and Kaggle." Its documentation details a rigorous deduplication pipeline, including dataset IDs, names, shapes, feature names, row and column hashes, manual metadata inspection, and deduplication against internal benchmarks and the entire TabArena suite. TabDPT takes this approach further by pretraining on 123 OpenML datasets. Given that TabArena’s datasets are also sourced from OpenML, this overlap raises concerns about potential contamination, as noted in a recent ensembling paper which suggests that reported gains should be considered "upper bounds." While specific deduplication pipelines may be robust, independent verification is challenging. The incentive structure clearly favors incorporating real data for Elo gains, placing the burden of proving clean acquisition on the researchers. This mirrors the situation with self-declared "No" leakage flags in other evaluation frameworks.
The provenance map of the TabArena leaderboard, as determined by this audit, illustrates this trend:
(Image description: A stacked bar chart showing the data provenance of models on the TabArena leaderboard. Categories include "Synthetic Only," "Synthetic + Real," and "Real + Deduplication." Models with "Synthetic Only" provenance, like TabICLv2, are clearly positioned below models with "Real + Deduplication" or "Synthetic + Real" provenance.)
For practitioners seeking the most trustworthy predictions on their own data, models with synthetic-only pretraining, such as TabICLv2, offer the cleanest evidential position. For those pursuing the marginal gains of 100-200 Elo points, this often involves trusting the data provenance claims of other models or conducting their own held-out evaluations.
Hybrid Headroom: Orchestrating Model Strengths
The potential for complementary models to enhance performance through routing strategies has been explored. TabArena’s published artifacts, uniquely, include per-split validation errors alongside test errors. This enables the evaluation of both an "oracle router" (which selects the superior model per dataset based on test error, a theoretical ceiling due to data leakage) and a "deployable router" (which uses validation error, a realistic scenario). These evaluations are purely computational, combining published results rather than running models directly. The Elo calculations are performed within a custom pool including all 78 published methods plus the routers, inclusive of imputed methods, leading to slight variations in absolute Elo scores compared to the main board (e.g., TabICLv2 at 1571 here versus 1590 on the website).
The complementarity between models is demonstrably significant, even extending to the GBDT family. An oracle router that selects between TabICLv2 and a tuned LightGBM model achieves an Elo of 1674, a gain of +103 Elo points over TabICLv2 alone. This comes from a partner model that sits 160 Elo points lower. While TabICLv2 wins head-to-head on 42 out of 51 datasets, the remaining nine are crucial enough to unlock this substantial headroom. The oracle router combining two foundation models achieves an even higher Elo of 1707, surpassing all models on the board except the unaudited TabFM.
The deployable router, utilizing validation errors, proves effective when orchestrating between foundation models. Selecting between TabICLv2 and TabPFN-2.6 based on validation error yields an Elo of 1645, exceeding both individual models and recovering approximately half of the oracle headroom without requiring knowledge of test set performance.
However, this router backfires when attempting to combine foundation models with GBDTs. A validation-picking router between TabICLv2 and tuned LightGBM results in an Elo of 1534, falling below the performance of TabICLv2 alone. While the oracle router indicates a potential +103 Elo gain, validation-based selection not only fails to capture this but also underperforms by 37 Elo points, likely due to the non-comparable validation error estimates between the two model families. The GBDT’s bagged internal validation estimates appear overly optimistic when juxtaposed with those of the foundation model. While the exact mechanism is a subject of ongoing research, the measured outcome is clear: a more sophisticated selection signal than raw validation error is required to effectively leverage the strengths of GBDT models in hybrid systems.

Concluding Remarks: A New Frontier in Data Analysis
The findings presented underscore a transformative shift in tabular data analysis. A 28 million parameter, open-weight model, pretrained entirely on synthetic data, has successfully replicated its public benchmark standing on independent hardware with minimal cost and computational effort. The benchmark itself reveals that every tuned and ensembled gradient-boosted tree configuration is surpassed by these tabular foundation models by at least 158 Elo points. The most compelling aspect of this development is the evidential position: open weights, synthetic-only pretraining, and a rigorously recomputed scoring pipeline provide a high degree of trustworthiness. While TabFM currently leads the board, its unaudited provenance and licensing issues necessitate caution. Similarly, gated models like the TabPFN line, while strong, do not offer the same level of open access.
For practitioners facing tabular data challenges today, a clear decision rule emerges: for tables with fewer than a hundred features and modest row counts, TabICLv2 offers state-of-the-art performance in a zero-shot, seconds-fitting framework, with fully open weights. For datasets characterized by high dimensionality or complex categorical features, tuned GBDTs remain the optimal choice. When deploying multiple models, if both candidates are foundation models, a validation-picking router can enhance accuracy. However, across the foundation model and GBDT divide, such routers prove detrimental, and a more nuanced selection mechanism is required.
Future research directions include independently verifying the performance of TabPFN models and exploring weighted ensembles of foundation models and GBDTs. The goal is to ascertain how much of the observed oracle headroom can be recovered by real-world hybrid systems, particularly for high-dimensional datasets where simple routers falter. The era of tabular foundation models has unequivocally begun, promising increased accuracy, efficiency, and accessibility in data analysis.
Related posts: