Optimizing Core Web Vitals: A Case Study on Improving Cumulative Layout Shift for Global Web Traffic

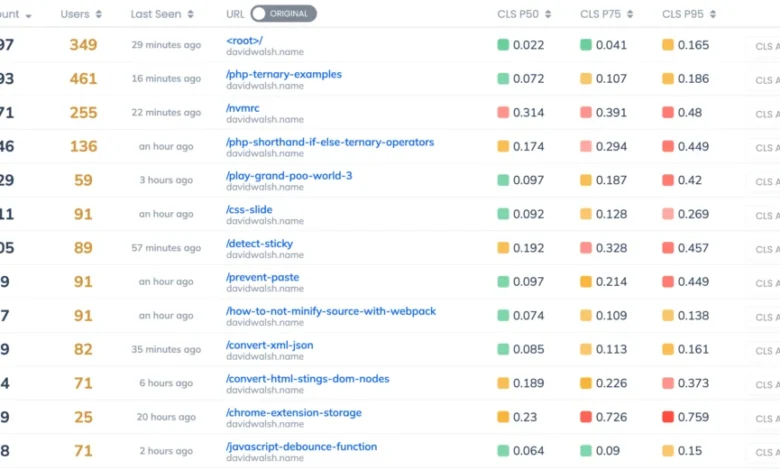
Over 50,000 developers visit DavidWalshBlog every month from around the world to learn JavaScript tricks and fix problems in their code, yet for many, the experience has historically been marred by inconsistent loading performance. As web standards evolve, the pressure on content creators to maintain high-speed, stable interfaces has intensified, shifting the focus from simple page load times to the nuanced metrics defined by Google’s Core Web Vitals. Among these, Cumulative Layout Shift (CLS) has emerged as a critical indicator of user experience stability, prompting a recent performance audit of the DavidWalshBlog platform.
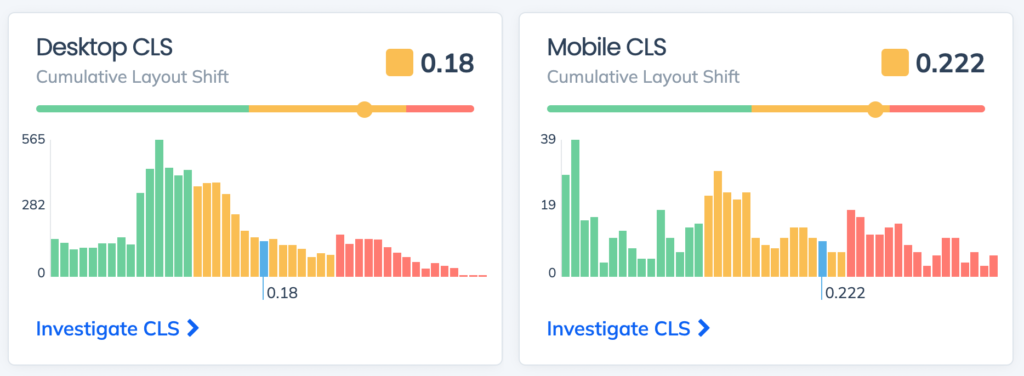
Understanding the Mechanics of Cumulative Layout Shift
Cumulative Layout Shift is a user-centric metric that quantifies the frequency and severity of unexpected visual movements on a webpage during the loading phase. Unlike traditional metrics that measure how long it takes for a page to become interactive or paint its first pixel, CLS monitors the stability of the Document Object Model (DOM). When elements—such as images, advertisements, or text blocks—reposition themselves after the initial render because their final dimensions were not predetermined, the result is a jarring user experience.
The implications of poor CLS scores extend beyond user frustration. Google has explicitly integrated Core Web Vitals into its search ranking algorithm, meaning that sites failing to maintain a "Good" threshold (a score of 0.1 or less) may experience a decline in search engine visibility. For professional blogs, media outlets, and e-commerce platforms, these shifts are not merely aesthetic inconveniences; they represent a tangible threat to traffic, engagement, and long-term search engine optimization (SEO) viability.
The Fallacy of Synthetic Testing
In the quest to address these performance deficits, many developers rely on synthetic testing tools, most notably Google Lighthouse. While Lighthouse serves as a foundational diagnostic tool, it is essential to distinguish between its capabilities and those of real-user monitoring (RUM).
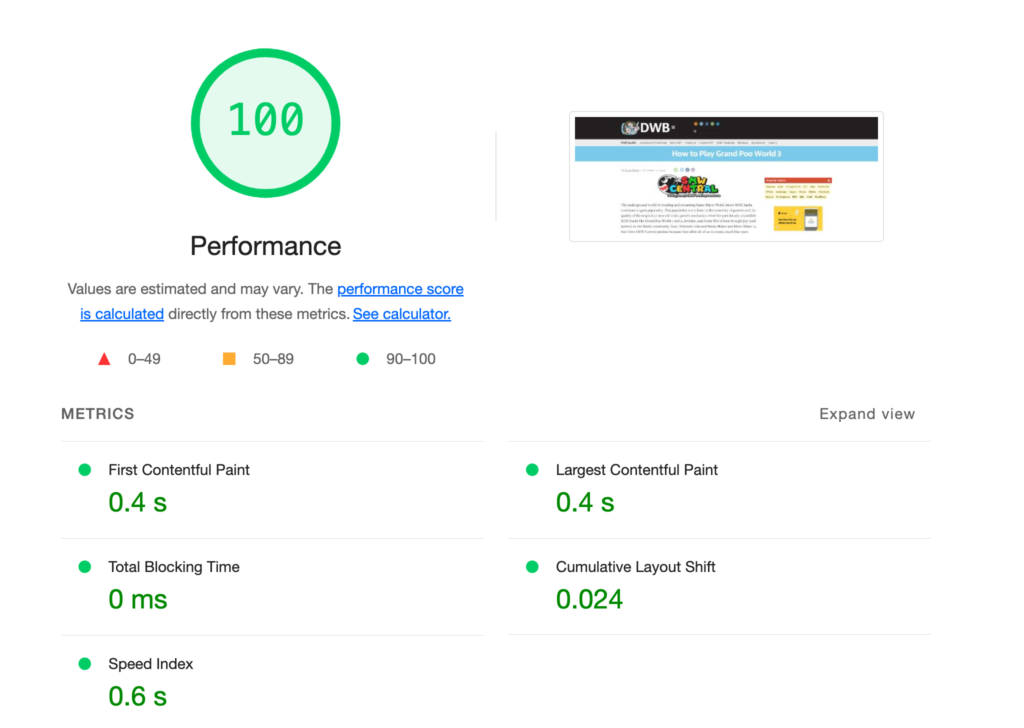
A recent audit of the DavidWalshBlog site initially yielded a "perfect" score under synthetic testing conditions. However, this result was misleading. Lighthouse generates its report based on a single controlled simulation, typically conducted on a high-speed fiber connection from a specific geographic location using a high-end workstation. It does not account for the reality of the global audience, which includes users on varying mobile devices, congested cellular networks, and disparate geographic locations.
The discrepancy between a perfect Lighthouse score and the actual user experience highlights a common trap in web performance engineering: optimizing for the test rather than the user. To achieve an accurate assessment, administrators must implement RUM, which captures performance data from every visitor’s browser, providing a longitudinal look at how real-world variables—such as latency, device processing power, and cache hits—affect the site.
Chronology of the Performance Audit
The performance investigation began following a trend analysis of the blog’s Core Web Vitals via Request Metrics. By reviewing the aggregate performance data, the team identified that the CLS score was trending toward suboptimal levels on both mobile and desktop platforms.
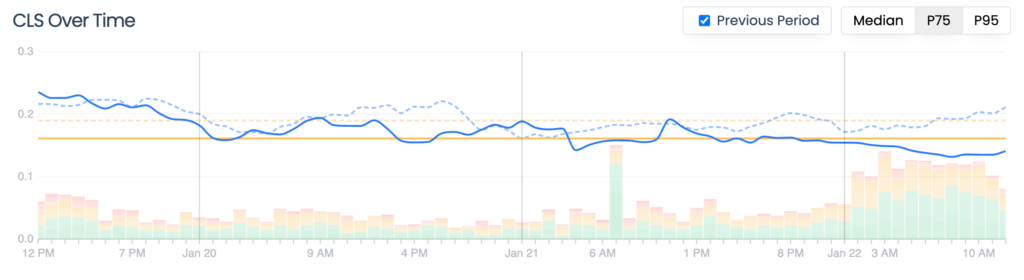
- Initial Discovery: Data analytics revealed a consistent decline in layout stability, specifically on high-traffic article pages.
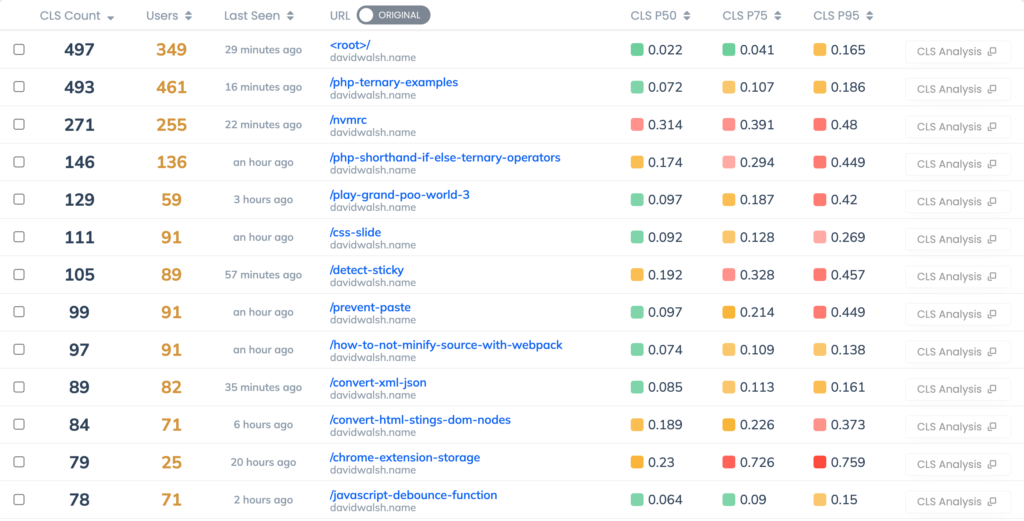
- Granular Analysis: By utilizing RUM data, the team isolated the issue to specific page types rather than a site-wide failure. High-traffic pages, including "Play Grand Poo World" and the "Pornhub Interview," were identified as outliers with significantly higher-than-average CLS scores.
- Element Identification: Further technical investigation pointed to the CSS selector
main > article > pas the primary culprit. The data suggested that the initial paragraphs of articles were shifting downwards as subsequent elements, specifically images, were rendered into the DOM. - Root Cause Analysis: The investigation confirmed that the absence of explicit dimension attributes for images was the primary driver of the shifts. As the browser rendered the text content before downloading the accompanying images, it allocated zero space for the media assets. Once the images were fetched, the browser forced a layout recalculation, pushing the existing content down the page.
The Technical Solution: Dimension Attribution
The resolution of the CLS issue required a fundamental change in how images are served. Modern browsers require "hints" to reserve the correct amount of space in the layout before an image file is fully downloaded. By incorporating the width and height attributes directly into the <img> tag, developers can define an aspect ratio that the browser uses to allocate the necessary space in the layout, regardless of the device’s screen size.
This technique is distinct from using CSS for sizing. While CSS can scale an image, the raw HTML attributes provide the browser with the intrinsic dimensions required to maintain the aspect ratio and reserve space in the layout before the CSS is even parsed. Notably, these attributes are defined as integers without unit identifiers (e.g., width="300" height="100"), ensuring compatibility across all modern rendering engines.

For a WordPress-based platform like DavidWalshBlog, implementing this on a manual, per-image basis would be labor-intensive. Instead, the team leveraged the wp_image_src_get_dimensions function. This allows the backend to dynamically inject the correct image dimensions into the HTML markup during the server-side rendering process, ensuring that every image, regardless of its source, contributes to a stable layout.
Broader Implications and Results
Following the implementation of these changes, the results were quantifiable within a matter of days. The site’s aggregate CLS score dropped by 20%, bringing the platform significantly closer to the "Good" performance tier as defined by Google.

This case study serves as a microcosm of a larger challenge facing the web development community. As websites grow in complexity, the "performance tax" paid by users increases. However, the solutions are often rooted in fundamental web standards that are frequently overlooked in favor of complex frameworks or heavy third-party scripts.
The implications for developers are clear: performance is an ongoing process of monitoring, identification, and remediation. Relying on "set and forget" performance optimization or synthetic testing is insufficient. True optimization requires a continuous feedback loop between real-user data and technical implementation.

Looking Ahead: The Future of Site Stability
While the primary CLS issue regarding image rendering has been addressed, the investigation into the site’s performance also uncovered secondary areas for improvement, particularly regarding web font loading. Asynchronous font loading is a common cause of "flash of invisible text" (FOIT) and layout shifts, which represent the next phase of the optimization roadmap for the site.
The shift toward user-centric metrics is a positive development for the internet ecosystem. By prioritizing the stability and speed of the user interface, developers ensure that content remains accessible and engaging. For DavidWalshBlog, the transition to rigorous performance monitoring has provided not only a faster experience for its 50,000-plus monthly visitors but also a more resilient foundation for its continued role as an educational resource in the development community.

As industry standards continue to evolve, the tools used to track these metrics—such as Request Metrics—will likely become standard components of the developer’s toolkit. The ability to distinguish between "lab" performance and "field" performance is no longer a luxury; it is a necessity for anyone looking to maintain a competitive presence in an increasingly crowded and performance-conscious digital landscape. The lesson for the broader community is simple: monitor what your users actually see, identify the specific elements causing instability, and adhere to the fundamental standards of the web to ensure long-term stability and success.