Demystifying the Logarithm: Bridging the Gap Between Mathematical Theory and Data Literacy

For many data professionals navigating the complex landscape of modern analytics, mathematical concepts often feel like an impenetrable barrier. While business intelligence, data science, and big data analysis have become cornerstones of the contemporary corporate world, the underlying mathematical foundation—specifically the role of logarithms—is frequently misunderstood or poorly communicated. This knowledge gap is not a reflection of professional competence, but rather a byproduct of an educational system that often emphasizes rote memorization over the intuitive application of mathematical principles. As data becomes the primary currency of the global economy, the ability to interpret and visualize data correctly, particularly when using logarithmic scales, has transitioned from a niche academic requirement to an essential professional skill.
Historical Context and the Evolution of Logarithmic Theory
The development of logarithms marks a pivotal moment in the history of science and navigation. Developed independently by John Napier in the early 17th century and Joost Bürgi, logarithms were originally designed to simplify complex calculations. By converting the operation of multiplication into the simpler operation of addition, Napier’s tables allowed astronomers and navigators to perform calculations that would have previously taken days in mere hours.

Historically, logarithms served as the "calculators" of the pre-digital age. Before the widespread availability of electronic computers in the late 20th century, slide rules—which rely entirely on logarithmic scales—were the standard tool for engineers, architects, and scientists. This history provides crucial context for why logarithms appear in modern software: they were the original interface for managing vast numeric ranges. Understanding this heritage helps demystify why we still rely on them today to represent data that spans several orders of magnitude.
Defining the Logarithm: Beyond the Classroom
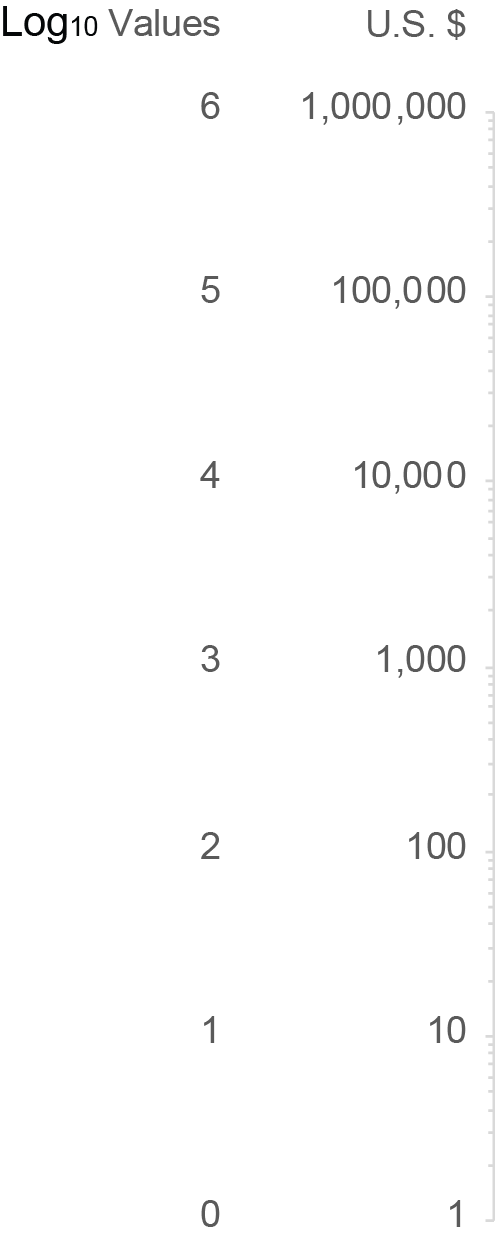
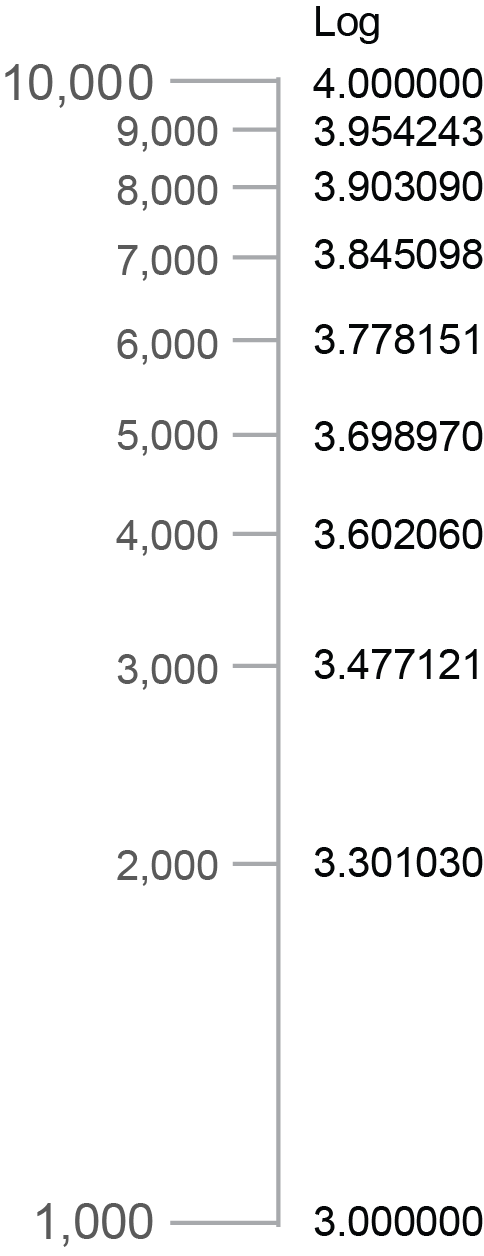
At its core, a logarithm is simply the inverse of exponentiation. If one considers an exponent as the result of raising a base number to a specific power, the logarithm is the exponent itself. For instance, in the equation 10 raised to the power of 3 (10³), the result is 1,000. In this scenario, the logarithm of 1,000 with a base of 10 is 3.
This relationship is essential for data analysts because it provides a mechanism to compress data that would otherwise be unreadable on a standard linear chart. While a linear scale increments by consistent values—such as 10, 20, 30, 40—a logarithmic scale increments by consistent factors. In a base-10 logarithmic scale, each interval represents a ten-fold increase. This is the primary reason why log scales are indispensable when plotting phenomena that exhibit extreme variance, such as stock market crashes, viral growth, or the magnitude of earthquakes on the Richter scale.

Chronology of Misconception: From Education to Industry
The confusion surrounding these concepts often stems from a disconnect between early schooling and professional application.
- Elementary and Middle School (Foundational Phase): Focus is placed on arithmetic and basic algebraic properties. Concepts like exponents are taught, but their inverse relationship—logarithms—is rarely introduced with practical, real-world utility.
- Undergraduate Education (Theoretical Phase): Statistics courses often introduce log-normal distributions or logarithmic transformations, but these are frequently presented as abstract mathematical requirements rather than tools for data sensemaking.
- Professional Entry (Application Phase): Data professionals often "stumble" into their roles, learning on the fly. When a visualization tool prompts for a "log scale," the user is often left to guess the impact on the audience’s interpretation of the data.
This trajectory suggests a systemic need for a more intuitive, rather than just academic, approach to teaching quantitative literacy in data-driven professions.
Supporting Data and Comparative Analysis
To distinguish between the types of growth that frequently confuse analysts, one must look at the rate of change.

Exponential Growth occurs when a quantity increases by a constant percentage over fixed intervals. This is the "compounding" effect, commonly seen in investment portfolios or population growth. If an investment grows at 10% annually, the absolute dollar amount of growth increases every year because the base value being multiplied is larger.
Logarithmic Growth, conversely, is characterized by a "diminishing return" effect. While the value continues to rise, the rate of that rise slows down significantly over time. A classic physical example is the deceleration of an object thrown upward; as gravity acts upon it, the height increases, but each subsequent second covers less distance than the previous one.
The following table illustrates the divergence between these two patterns:
| Interval | Linear (10) | Exponential (x2) | Logarithmic (log2) |
|---|---|---|---|
| 1 | 10 | 2 | 0 |
| 2 | 20 | 4 | 1 |
| 4 | 40 | 16 | 2 |
| 8 | 80 | 256 | 3 |
| 16 | 160 | 65,536 | 4 |
The Implications for Data Visualization
In the newsroom and the boardroom, the choice of scale can either illuminate or deceive. When a chart creator uses a linear scale to display exponential growth, the curve quickly shoots off the top of the graph, making it impossible to see nuances in the earlier data points. By switching to a logarithmic scale, the exponential curve is "flattened" into a linear trend.
However, this brings a significant risk of misinterpretation. A casual viewer, accustomed to reading linear graphs, might misinterpret a log-linear trend as a sign of stabilization or deceleration. The responsibility lies with the data professional to annotate the chart clearly, ensuring that the audience understands they are viewing the data through a logarithmic lens. Failure to do so can lead to poor decision-making, as stakeholders may mistake a consistent growth rate for a flattening of performance.
Expert Perspectives and Industry Standards
Industry experts in data visualization, such as those at the Data Visualization Society, emphasize that "clarity over complexity" should be the primary objective. The consensus among professionals is that logarithmic scales should be reserved for specific use cases:

- When data spans several orders of magnitude: If your data ranges from 10 to 1,000,000, a linear scale will hide the behavior of the smaller values.
- When viewing rates of change: Log scales allow for the comparison of growth rates across different time periods regardless of the absolute starting value.
The impact of these choices is profound. In the context of public health, for example, the use of log scales during the COVID-19 pandemic allowed researchers to compare the speed of contagion across regions with vastly different population sizes. Without the normalizing power of the logarithmic scale, the data would have been visually dominated by the most populous cities, effectively masking the outbreaks in smaller, yet equally critical, locations.
Broader Impact and Future Literacy
The democratization of data analytics means that more people than ever are tasked with creating and consuming charts. As we move further into the era of "Big Data," the ability to distinguish between types of growth is not just a mathematical parlor trick—it is a requirement for informed citizenship.
When a policy maker reviews a graph, or an investor examines a trend line, the presence of a logarithmic scale changes the narrative. If the professional community continues to treat these concepts as mysterious or overly academic, the risk of misinformation increases. By breaking down the components of logarithms—the base, the exponent, and the inverse relationship—we provide the tools necessary for a more accurate understanding of the world.
The goal for the modern analyst should be to reach a level of comfort where the selection of a scale is a deliberate, informed decision. By moving beyond the fear of "hard math" and embracing the logic behind these systems, data professionals can ensure that their visualizations serve their intended purpose: to reveal truth, highlight trends, and foster better-informed decisions in an increasingly complex and quantitative landscape.