
visual
-
Data Analytics and Visualization

Visual Business Intelligence – New Edition of “Now You See It”
The core premise of the updated edition rests on the distinction between data visualization as a presentation tool and data…
Read More » -
WordPress Ecosystem
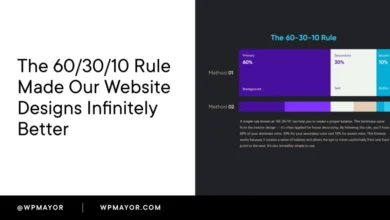
Mastering Visual Hierarchy: The 60/30/10 Color Rule in Web Design
The 60/30/10 rule is a foundational color proportion guideline that meticulously divides a design into three distinct parts: 60% dominant…
Read More » -
Tech News Global

Pinterest Surpasses One Billion Dollar Quarterly Revenue Milestone as AI-Driven Visual Search Intent Outpaces Social Media Engagement
Pinterest has officially entered a new financial era, reporting its first-ever billion-dollar quarter with revenue reaching $1.008 billion for the…
Read More » -
Social Media Marketing

Pinterest: The Visual Discovery Engine Powering Inspiration and Commerce
Pinterest, the ubiquitous visual discovery engine, continues to solidify its position as a vital platform for inspiration, planning, and increasingly,…
Read More » -
Artificial Intelligence in Tech

Bridging the Visual Divide: Proxy-Pointer RAG Achieves Grounded Image Retrieval in Enterprise Chatbots
The adage "a picture is worth a thousand words" has long been a cornerstone of effective communication. Yet, for enterprise…
Read More »
