The Misleading Presentation of COVID-19 Data: How Selective Reporting Distorts Public Perception

In the midst of a global health crisis, the accuracy and transparency of public data reporting are paramount to informed decision-making. As the COVID-19 pandemic continues to unfold, news organizations play a critical role in interpreting complex statistical information for the public. However, recent analysis suggests that even reputable media outlets may inadvertently propagate misleading narratives through selective data visualization. A prime example occurred following the August 3, 2020, interview between President Donald Trump and Axios journalist Jonathan Swan, which sparked a national conversation regarding the interpretation of mortality metrics.
The Genesis of the Debate: The Axios Interview
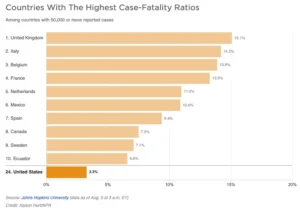
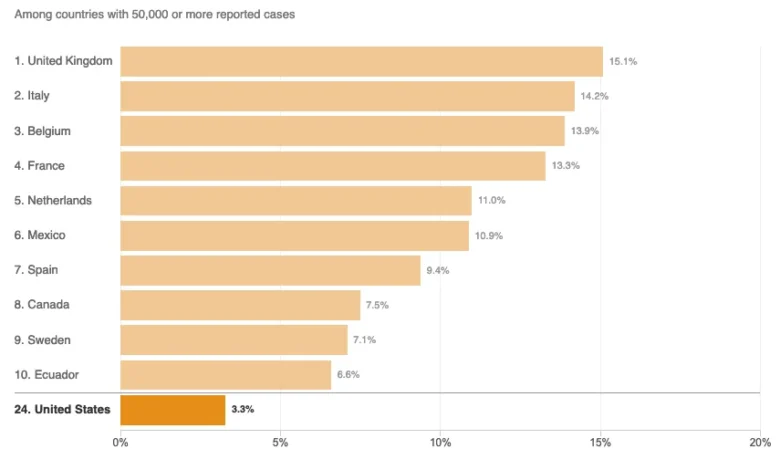
The controversy began during a televised interview on HBO, where the discussion turned to the United States’ handling of the COVID-19 pandemic. When questioned about the rising death toll, President Trump presented a chart intended to show that the U.S. was performing better than other nations. The chart relied on the "case fatality ratio"—the number of deaths relative to the number of confirmed infections.
Jonathan Swan countered by highlighting the "deaths per capita" metric, which calculates the mortality rate relative to the total population. The President dismissed this approach, stating, "You can’t do that," implying that per capita comparisons were invalid. This exchange highlighted a fundamental tension in public health communication: the conflict between political messaging and statistical methodology. Both case fatality ratios and per capita mortality are essential analytical tools, yet they provide vastly different insights into a country’s disease burden.
Chronology of the Reporting Crisis
Following the interview, various media outlets sought to provide context to the President’s claims. On August 5, 2020, NPR published an article titled "Charts: How the U.S. Ranks On COVID-19 Deaths Per Capita — And By Case Count," written by Jessica Craig. While intended to clarify the data, the article utilized truncated charts that critics argue obfuscated the reality of the U.S. standing.
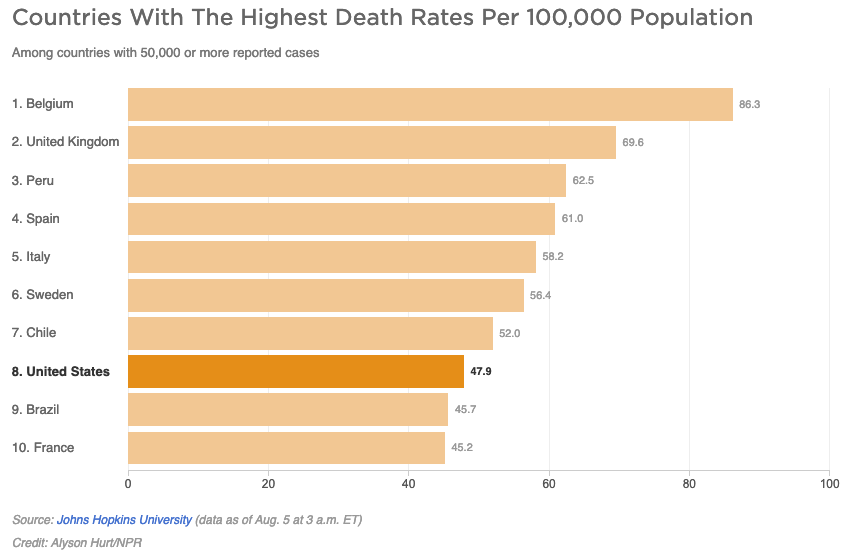
The NPR article presented two primary visualizations: one comparing deaths per capita and another comparing case fatality ratios across countries with more than 50,000 reported cases. By August 5, 2020, at least 45 nations had crossed the 50,000-case threshold. However, the NPR charts limited their scope to the "top 10" nations. This arbitrary filtering, often referred to as the "curse of the top 10," resulted in a misleading presentation of the data, as it excluded the majority of countries that were performing significantly better than the United States.
Statistical Analysis: The Dangers of Selective Visualization
Data visualization experts have long warned against the practice of "cherry-picking" data points. By limiting a comparative chart to the top ten nations, a news organization creates an artificial ranking that suggests the included countries represent the entire landscape of global performance. In the case of the NPR mortality chart, the visual layout suggested that only two nations—Brazil and France—were performing worse than the U.S. In reality, the U.S. ranked significantly lower than dozens of other countries.
The reliance on truncated datasets is not merely a stylistic choice; it is a methodological failure that distorts public understanding. If a chart includes only a subset of relevant data, it can lead the reader to believe that the displayed sample is representative of the whole. When the data is suppressed, the audience is left with a fragmented view that can be manipulated to support pre-existing political narratives.
Contextualizing Disease Burden and Mortality
The NPR report further attempted to explain the data by citing Justin Lessler, an associate professor of epidemiology at Johns Hopkins University. The article stated that the per capita death rate is primarily an indication of the "overall disease burden in a country." This definition, however, is statistically imprecise.
In epidemiological terms, "disease burden" is a technical metric that accounts for the impact of a disease in terms of years of life lost and disability-adjusted life years (DALYs). The per capita death rate measures the proportional mortality within a population, which is distinct from the absolute volume of the disease’s impact. Conflating these two terms complicates the public’s ability to understand the distinction between mortality rates (how many people die relative to the population) and the broader economic or societal burden of the pandemic.
Official Responses and Academic Perspective
While NPR and other outlets sought to maintain an "even-handed" approach, public health experts have consistently emphasized that mortality data must be presented with full transparency to be effective. The American Public Health Association (APHA) and other similar bodies have advocated for the inclusion of all relevant demographic and geographical data when comparing international responses to a pandemic.
When media outlets provide "both-sides" coverage that gives undue weight to inaccurate claims—such as the President’s assertion that the U.S. was "doing better than any other country"—they risk legitimizing misinformation. By attempting to bridge the gap between factual reality and the President’s rhetoric, the reporting in question often failed to provide the necessary correction to the narrative, instead creating a middle ground that did not reflect the empirical data.
Broader Implications for Media Literacy
The incident highlights a critical challenge for modern journalism: how to report on high-stakes political figures who use data in bad faith. If a media organization attempts to remain neutral by including the politician’s chosen metrics alongside objective data, they may inadvertently validate a false premise.
Effective journalism requires more than the mere inclusion of numbers; it requires the context of those numbers. To properly inform the public, media outlets must:
- Avoid Arbitrary Cut-offs: When comparing data, show the entire relevant set (e.g., all countries with a certain case count) rather than a curated top-10 list.
- Define Technical Terms Accurately: Ensure that terms like "disease burden" are not used interchangeably with "per capita mortality," as this can confuse the public regarding the severity of the pandemic.
- Prioritize Factual Correction: When a political figure makes a demonstrably false claim, the role of the press is to provide the empirical evidence that contradicts it, rather than offering a "balanced" visualization that obscures the truth.
Conclusion: The Responsibility of the Press
The pandemic has accelerated the demand for data-driven reporting, but it has also exposed the vulnerabilities of current journalistic practices. As information moves faster than ever, the pressure to produce charts and infographics can lead to errors that undermine public trust.
The NPR article serves as a case study for why media organizations must remain vigilant against the "curse of the top 10" and other visualization traps. As the global community continues to grapple with the long-term effects of COVID-19, the standard for data journalism must be set higher. Accuracy cannot be sacrificed for the sake of an aesthetic or "even-handed" narrative. Transparency remains the only reliable metric for success in reporting on a global crisis. The public relies on journalists to be the arbiters of truth, a responsibility that is never more critical than when lives and health policies are at stake. Moving forward, the industry must re-evaluate its approach to data visualization to ensure that the information provided to the public is not only accessible but also rigorously comprehensive and intellectually honest.