LinkedIn Unveils New Campaign Manager Companies Hub Strategy to Optimize B2B Prospecting and Account-Based Marketing

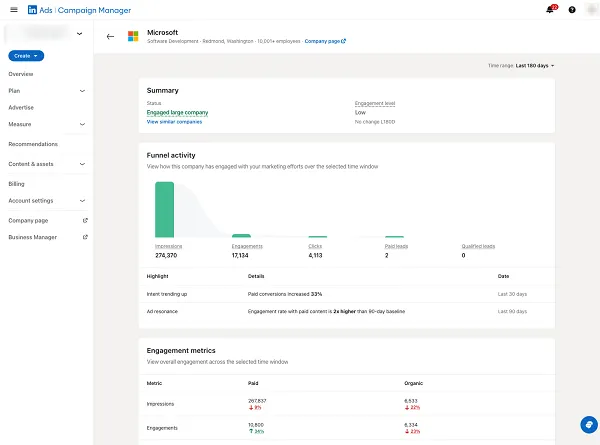
In the rapidly evolving landscape of digital business-to-business (B2B) marketing, precision and data-driven decision-making have become the foundational pillars of successful customer acquisition. LinkedIn, the world’s premier professional networking platform, has officially published a comprehensive new guide detailing how marketers can leverage the Companies hub within its Campaign Manager interface. This strategic overview is designed to help organizations effectively track engagement metrics from target accounts, identify high-intent prospects, and streamline their focus toward key decision-makers who hold purchasing power within their respective organizations.
The release of this framework arrives at a critical juncture for digital advertisers navigating tightening budgets and an increased demand for measurable return on investment (ROI). By transforming raw platform metrics into actionable insights, LinkedIn’s latest resource aims to bridge the persistent gap between top-of-funnel brand awareness and bottom-line pipeline generation.
Core Functionality of the LinkedIn Companies Hub
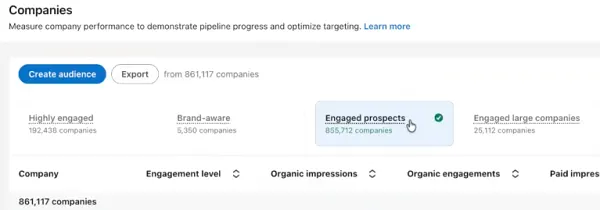
At the heart of this updated strategy is the Companies hub, a centralized data repository housed within LinkedIn Campaign Manager. This tool aggregates a robust array of in-app engagement points, granting brands unprecedented visibility into which corporate representatives are interacting with their digital footprint. Specifically, the hub tracks interactions originating from both organic company page posts and paid advertising campaigns deployed across the platform.
For modern marketing and sales teams, this capability solves a historically difficult challenge in B2B marketing: attributing macro-level engagement to specific micro-accounts. Rather than operating in the dark or relying solely on broad demographic filters, brands can now analyze granular data regarding which companies are showing active interest.
The utility of this data extends far beyond simple vanity metrics like impressions or clicks. By understanding precisely which organizations are engaging with their content, marketing departments can dynamically refine their audience targeting parameters. This ensures that subsequent advertising budgets are funneled exclusively toward high-intent companies that exhibit a statistically higher propensity to convert into paying customers.
The Four-Step Account-Based Marketing Framework
To operationalize these insights, LinkedIn has outlined a strategic four-step framework designed to transition organizations from passive observation to active pipeline acceleration. While the underlying mechanics rely on sophisticated data analytics, the process is structured for straightforward implementation by marketing teams of varying scales.
The foundation of this framework begins with account selection and data integration. LinkedIn advises organizations to analyze their historical customer data to identify a core cohort of target accounts that closely mirror their most profitable existing customers. Once these ideal customer profiles (ICPs) are established, marketers can seamlessly connect their customer relationship management (CRM) systems or upload custom company lists directly into the LinkedIn ecosystem.
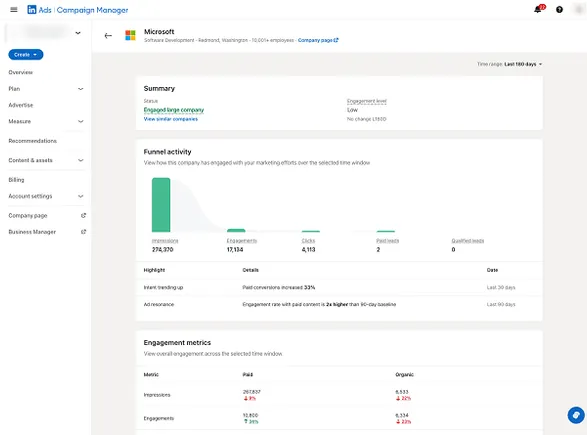
The second phase involves active monitoring. With the CRM data synchronized and target account lists uploaded, marketers utilize the Companies hub to observe organic and paid engagement in real-time. This phase acts as an intelligence-gathering period, allowing brands to track which targeted enterprises are actively consuming content, visiting company pages, or engaging with sponsored updates.
In the third phase, organizations shift from observation to action. LinkedIn recommends deploying tailored, nurture-focused campaigns specifically aimed at the accounts that have demonstrated measurable engagement during the monitoring phase. By isolating these warm prospects, brands can deliver hyper-relevant messaging that addresses specific pain points, moving these key decision-makers further down the sales funnel.
Finally, the fourth step centers on continuous optimization and alignment between sales and marketing teams—often referred to as "Smarketing." By sharing insights harvested from the Companies hub with sales development representatives (SDRs), organizations can synchronize their outreach efforts, ensuring that digital ad campaigns and direct sales touches occur in coordinated harmony.
Background Context: The Evolution of B2B Advertising on LinkedIn
To fully appreciate the significance of this new Campaign Manager update, it is essential to examine the broader trajectory of LinkedIn’s advertising ecosystem over the past decade. Launched originally as a digital resume repository and professional networking site, LinkedIn has progressively transformed into a dominant enterprise media channel.
In the early stages of digital B2B marketing, platforms relied heavily on rudimentary parameters such as job titles, industry categories, and geographic locations. While effective for basic segmentation, these methods frequently resulted in wasted ad spend due to outdated profile data or imprecise targeting. Recognizing the demand for more sophisticated solutions, LinkedIn began investing heavily in enterprise-grade marketing technology.
The introduction of Account-Based Marketing (ABM) capabilities marked a major turning point for the platform. As enterprise sales cycles lengthened and buying committees expanded—often involving an average of six to ten decision-makers for a single B2B purchase—marketers required tools that could target entire organizations rather than isolated individuals.
Over recent years, LinkedIn has systematically rolled out features to support this shift, including Matched Audiences, company engagement reports, and enhanced CRM integrations. The latest guidance on the Companies hub represents the maturation of these tools, packaging disparate data streams into a cohesive, repeatable methodology for modern revenue teams.
Industry Reactions and Expert Analysis
Digital marketing analysts and B2B practitioners have largely welcomed LinkedIn’s detailed framework, noting that it addresses a longstanding pain point in multi-touch attribution and account nurturing. Industry observers point out that as privacy regulations tighten and third-party cookies face obsolescence, first-party platform data—such as the proprietary insights available within LinkedIn Campaign Manager—becomes exponentially more valuable.
Marketing operations specialists have emphasized the strategic advantage of marrying CRM data with LinkedIn’s behavioral metrics. By feeding customer lists into the platform and monitoring real-time engagement shifts, organizations can significantly reduce the latency between a prospect showing interest and a sales representative initiating contact.
Furthermore, thought leaders in the ABM space have highlighted the psychological component of modern B2B buying behavior. Decision-makers rarely complete a purchase on a first interaction; instead, they conduct extensive independent research across multiple channels. By utilizing the Companies hub to identify which accounts are collectively researching a solution, brands can maintain a consistent, targeted presence during the critical evaluation window.
Economic Implications and Strategic Advantages for Enterprises
The financial implications of implementing a refined, data-centric targeting strategy on LinkedIn are profound. In an economic climate where corporate marketing budgets face intense scrutiny from chief financial officers, the imperative to eliminate wasted ad spend has never been higher.
Traditional display and social advertising models often suffer from high rates of ad fatigue and irrelevant impressions. By narrowing the focal point to high-intent companies identified through the Companies hub, enterprises can achieve a more favorable cost-per-acquisition (CPA). When ad creatives are served exclusively to organizations that have already exhibited behavioral indicators of interest, conversion rates naturally trend upward.
Moreover, this approach fosters greater internal alignment between marketing and sales departments. Historically, friction has existed between these two vital business units, with sales teams often complaining about the quality of marketing-generated leads, and marketing teams frustrated by a lack of follow-through. By utilizing a shared data source like the Companies hub to define and track target accounts, both teams operate from a single source of truth, thereby streamlining the entire revenue generation engine.
Broader Impact on the Digital Marketing Landscape
LinkedIn’s continuous refinement of its Campaign Manager tools underscores a broader industry trend: the shift toward walled gardens offering proprietary, high-fidelity professional data. Unlike consumer-facing social networks, LinkedIn possesses authenticated, professional-grade data tied directly to employment status, industry, and organizational hierarchy.
As competitors in the digital advertising space grapple with signal loss and regulatory headwinds, LinkedIn’s strengthening of its B2B data offerings positions the platform as an indispensable asset for enterprise marketing strategies. The ability to translate platform engagement into concrete account intelligence gives B2B brands a competitive edge that is difficult to replicate on open web display networks.
Looking ahead, industry experts anticipate further integration between professional social platforms and enterprise software stacks. As APIs become more sophisticated and real-time data synchronization becomes the industry standard, the boundary between CRM platforms and advertising campaign managers will continue to blur.
Conclusion: Actionable Takeaways for Modern Marketers
In summary, LinkedIn’s newly highlighted framework for the Campaign Manager Companies hub provides a clear, actionable roadmap for organizations seeking to optimize their B2B prospecting efforts. By systematically selecting ideal customer accounts, integrating CRM data, actively monitoring in-app engagement, and executing targeted nurture campaigns, brands can significantly enhance their promotional performance.
As the B2B marketplace grows increasingly competitive and complex, leveraging precision data tools will no longer be optional; it will be a prerequisite for sustained market leadership. For marketing professionals willing to adopt this structured, four-step methodology, LinkedIn offers a powerful pathway to turn passive digital engagement into active, high-value customer relationships.
Related posts: