Mastering X Analytics: A Comprehensive Guide to Data-Driven Social Media Strategy

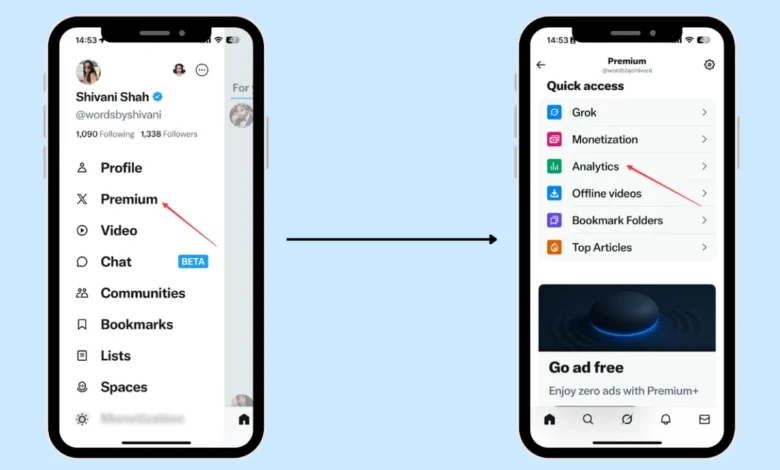
Social media platforms are characterized by rapid evolution, yet X—formerly known as Twitter—retains a unique position in the digital landscape. As the platform navigates its transition under new ownership and architectural shifts, the fundamental importance of understanding audience engagement has only intensified for creators and marketers. While the platform has undergone significant rebranding, the core necessity for data-driven decision-making remains constant. For those looking to optimize their digital presence, the ability to interpret performance metrics is no longer a luxury but a requirement for sustained growth.
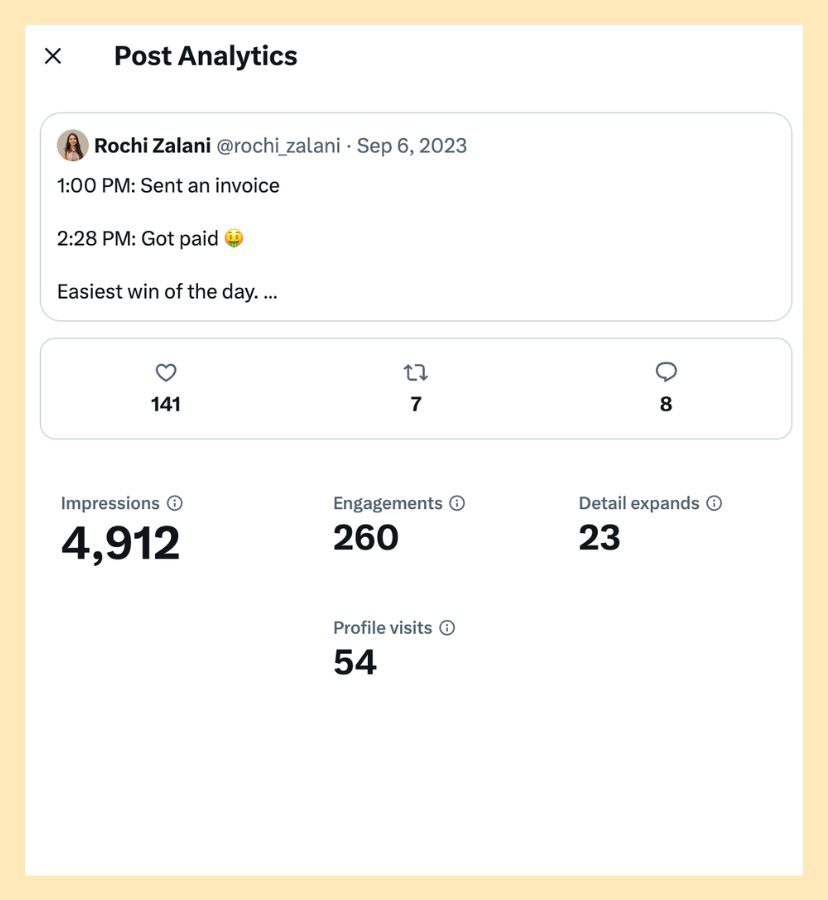
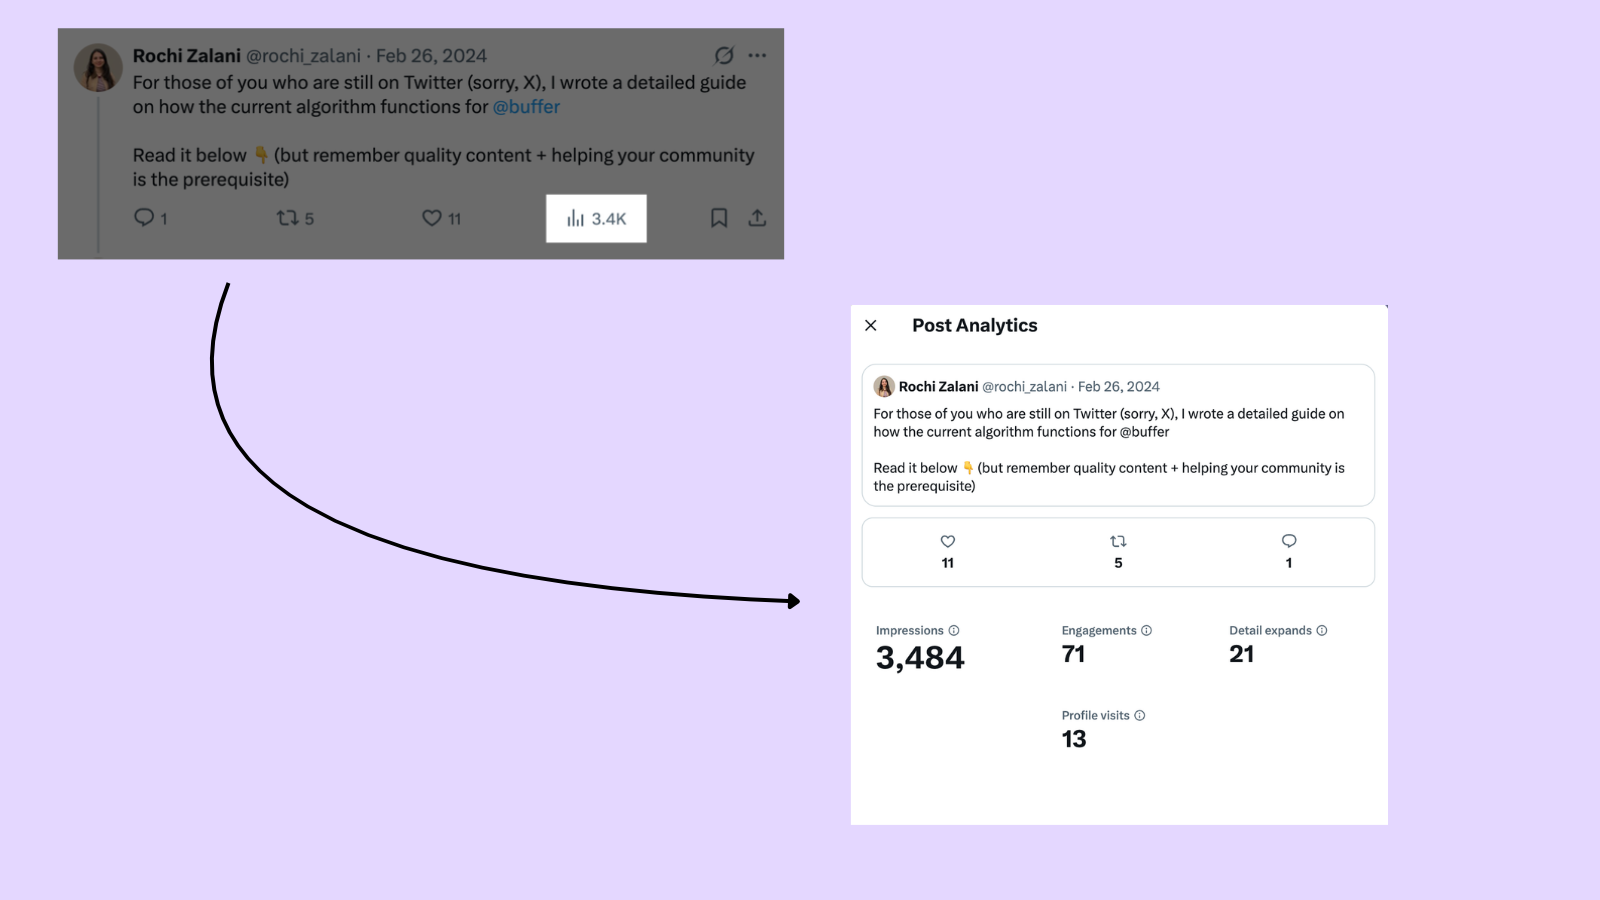
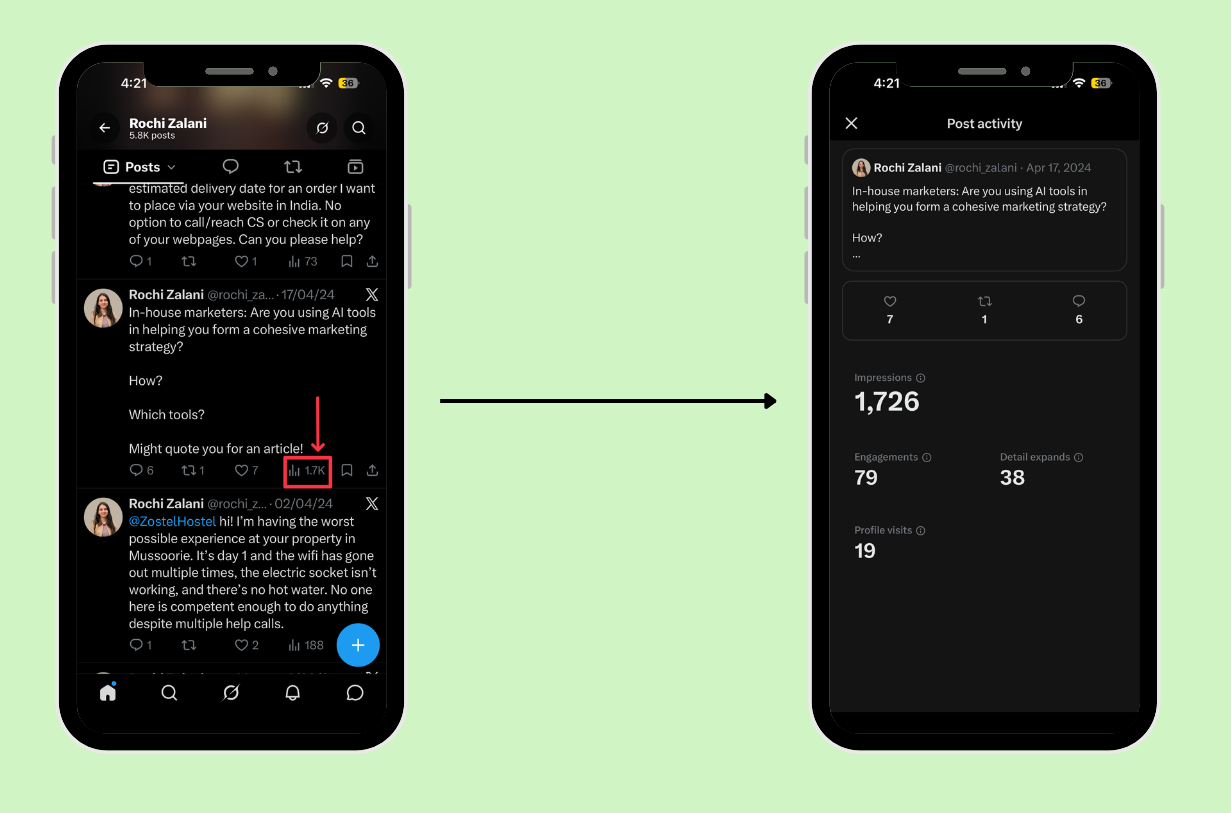
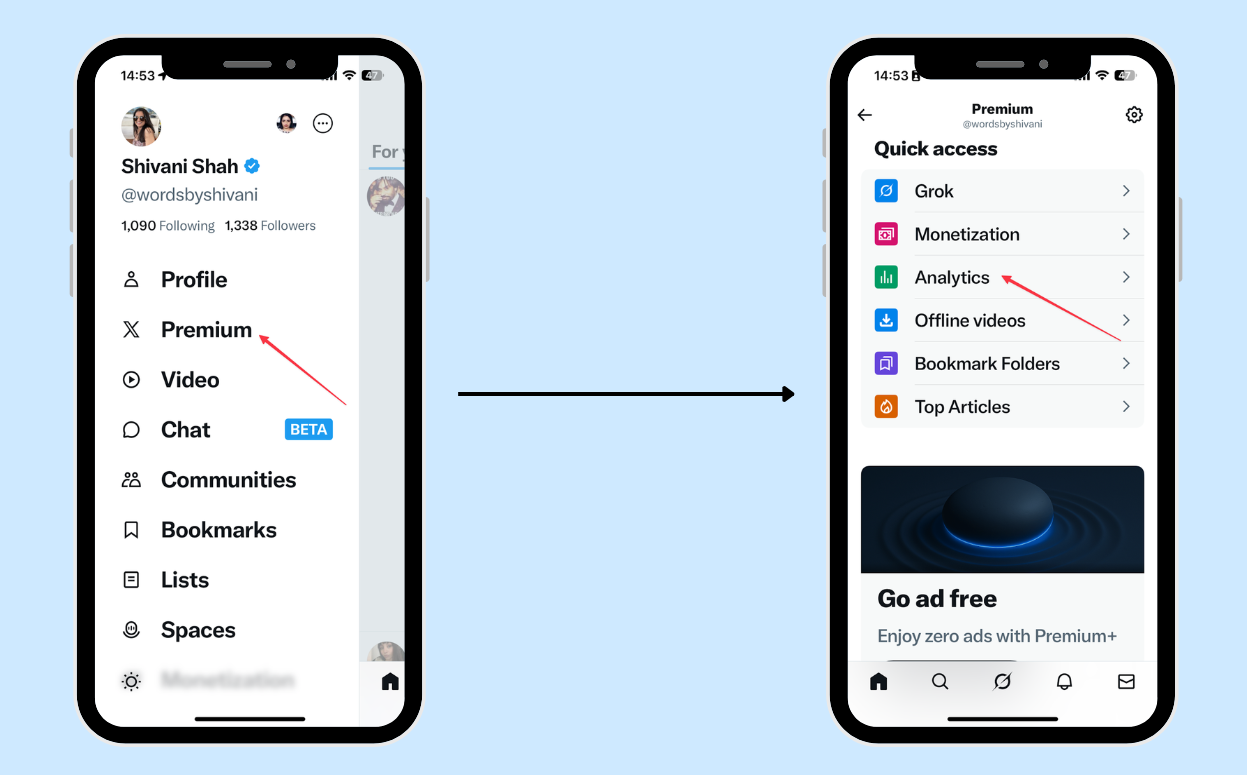
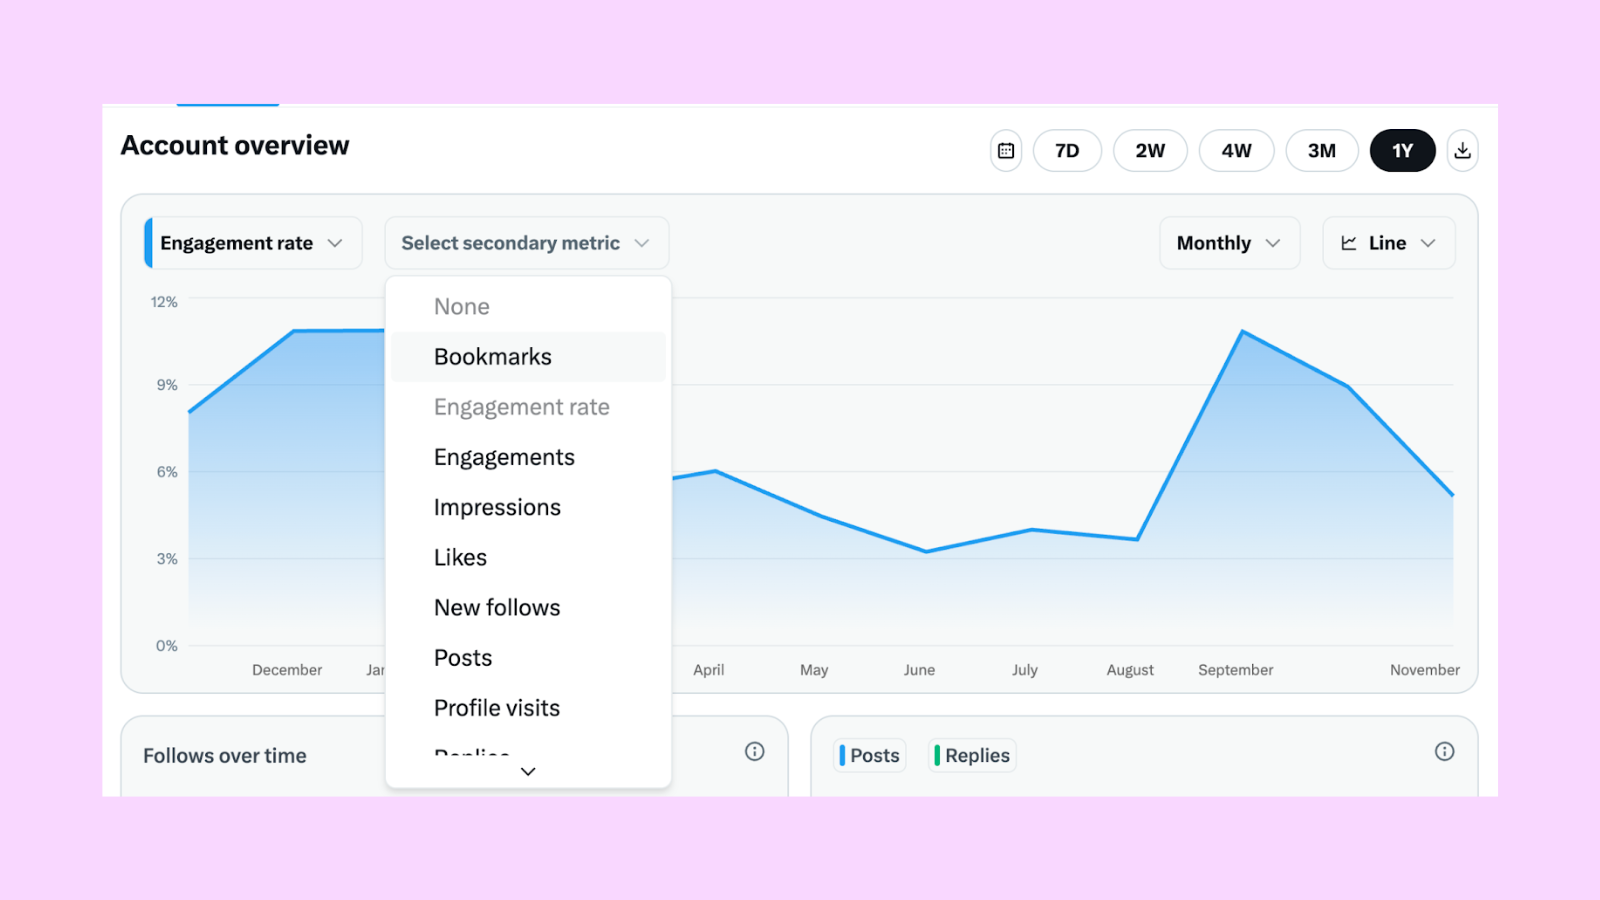
The current landscape of X analytics is bifurcated, split between native reporting tools and third-party solutions. Every user on the platform retains access to basic post-level metrics, such as impressions, engagements, profile visits, and link clicks. However, the depth of insight available depends heavily on a user’s subscription status. While X Premium offers an expansive dashboard including audience demographics and account-level trends, free-tier users often find themselves needing to aggregate data manually or utilize external platforms to achieve the same level of granular oversight.
The Evolution of X Analytics and Accessibility
The trajectory of X’s reporting tools has been marked by a shift toward a "freemium" model. Historically, the platform provided robust, free analytical data to all users. In the current iteration, access to comprehensive historical data, audience psychographics, and comparative performance charts is largely gated behind the X Premium subscription.
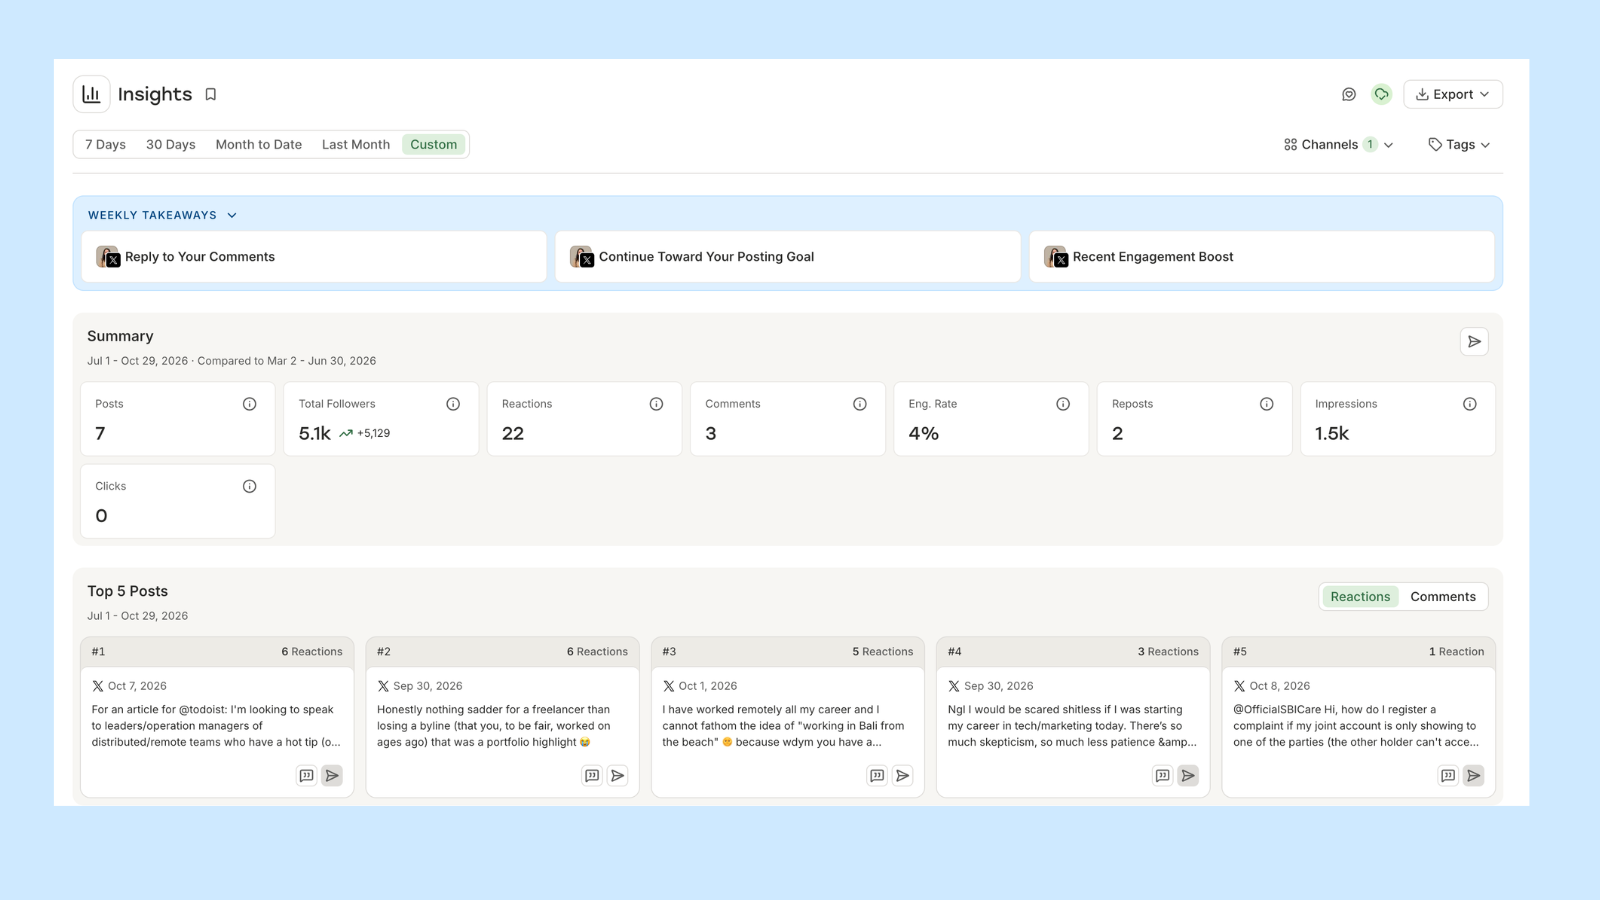
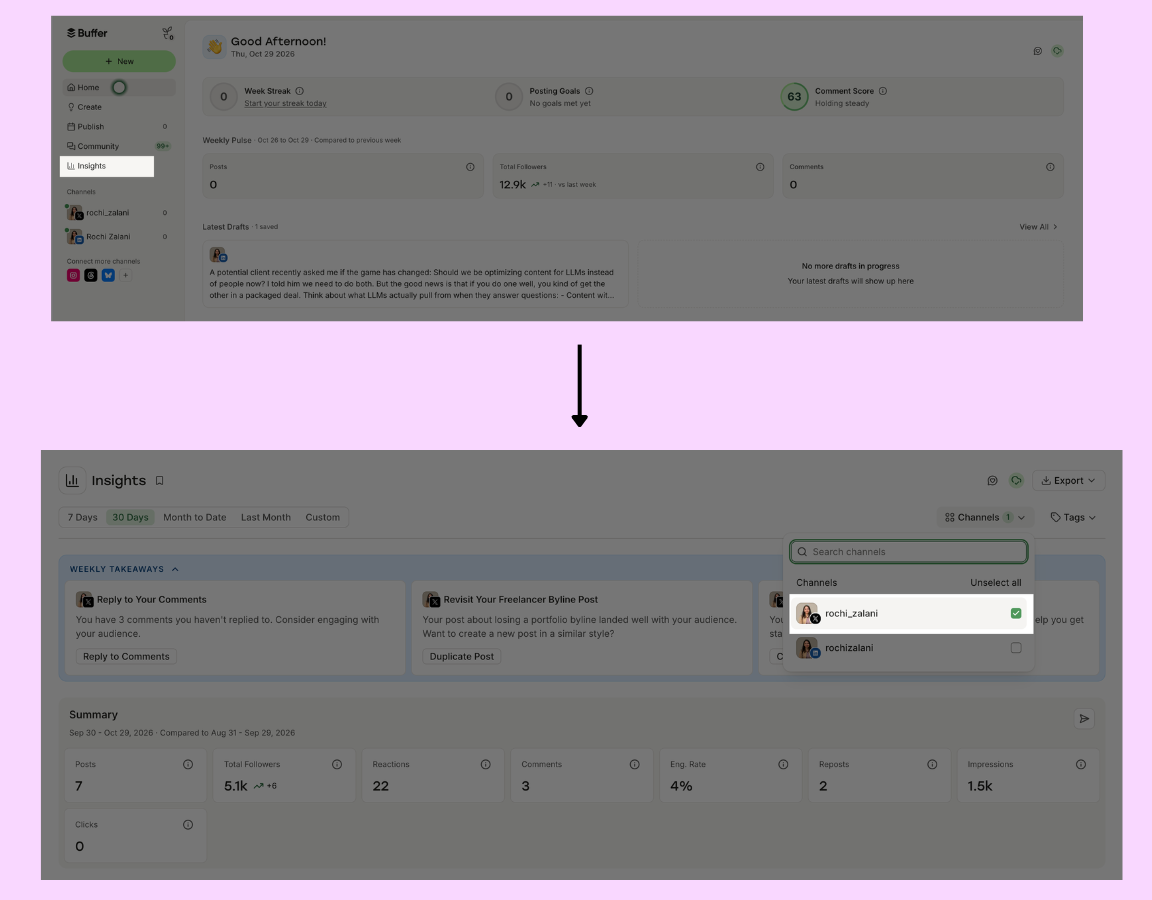
Data from early 2026 indicates that while X serves approximately 550 million monthly active users, the penetration rate of paid subscriptions remains relatively modest, estimated at roughly 4.4 million users. This discrepancy leaves a vast majority of the user base with limited visibility into long-term performance trends. Consequently, the reliance on third-party management tools, such as Buffer, has become a strategic pivot point for creators who wish to analyze performance without incurring the monthly costs associated with X Premium.
Essential Metrics for Strategic Performance
To evaluate the efficacy of a social media strategy, practitioners must look beyond vanity metrics like "likes" and focus on KPIs that drive tangible outcomes.
1. Impressions and Reach
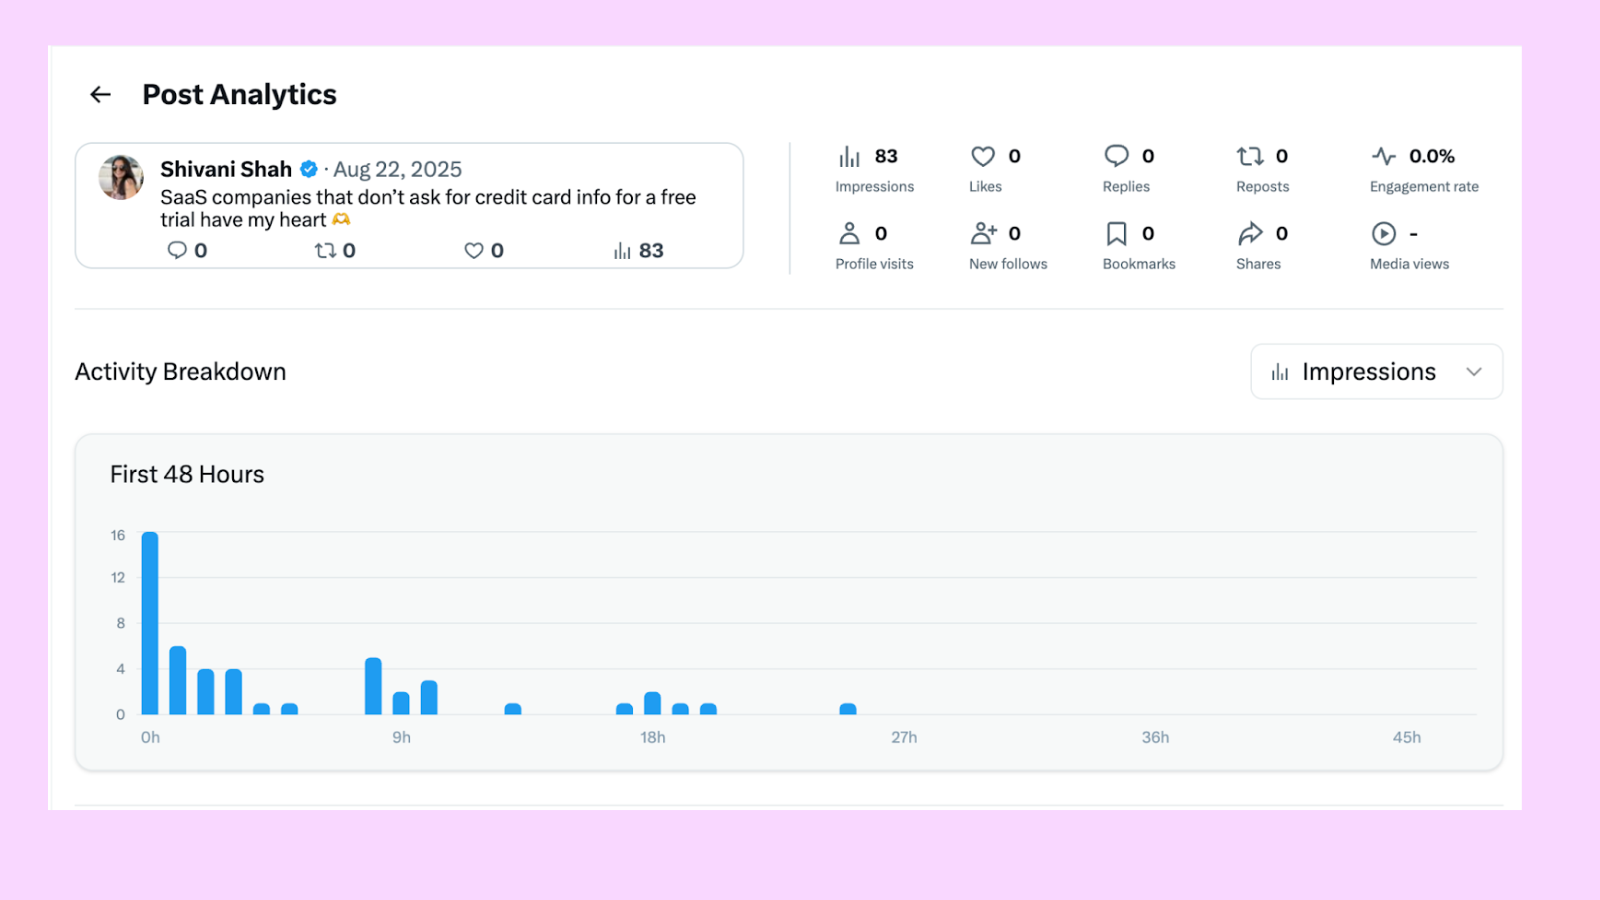
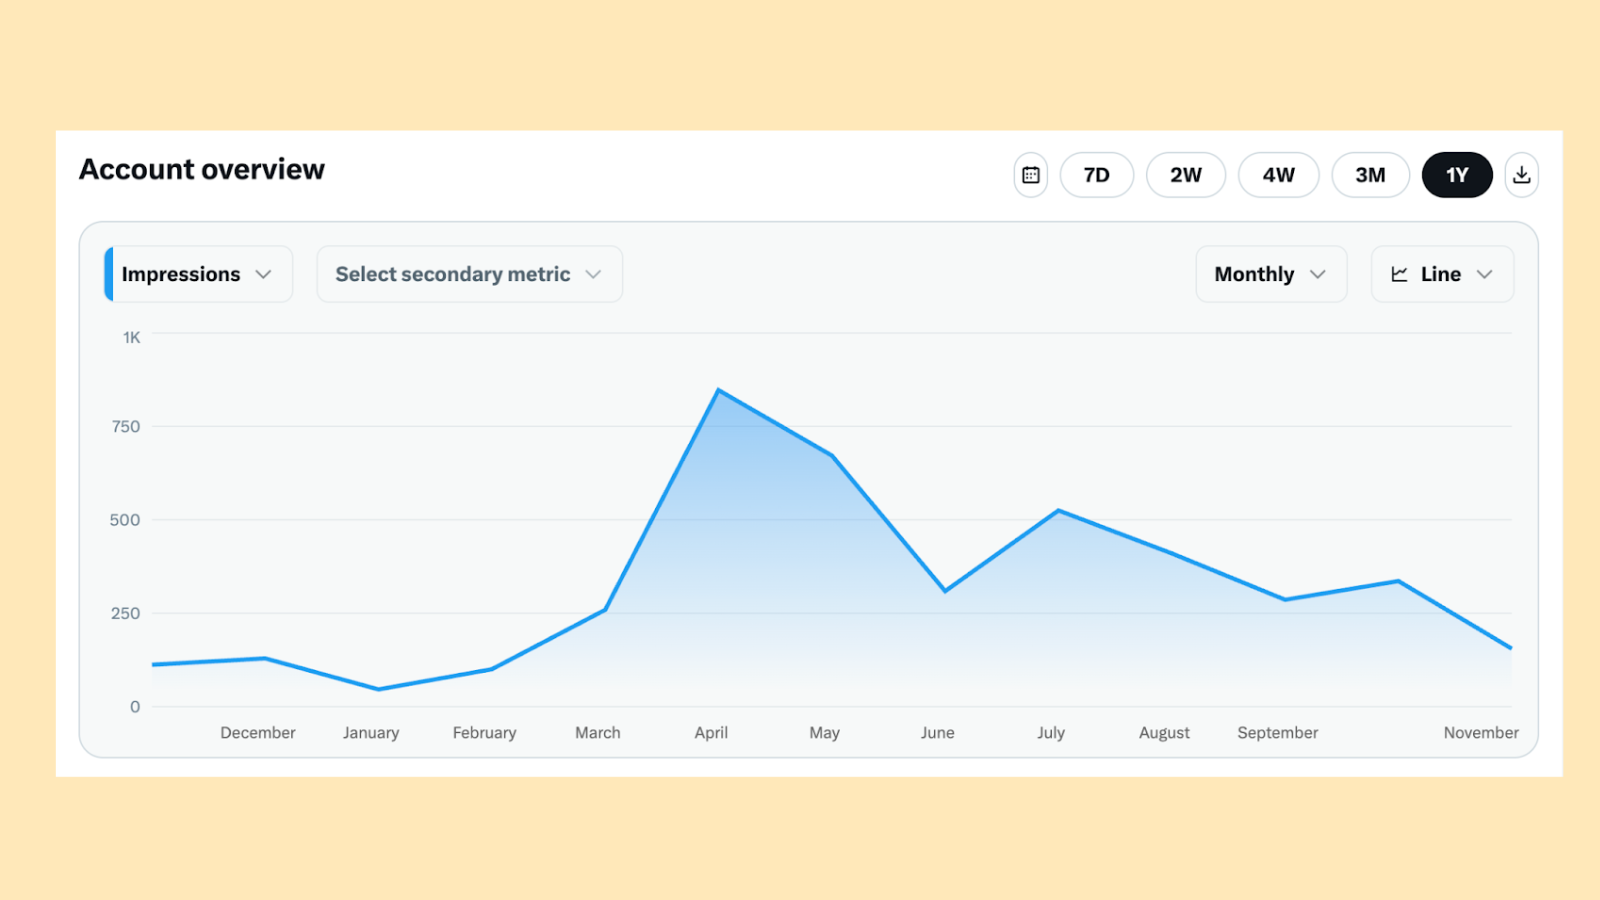
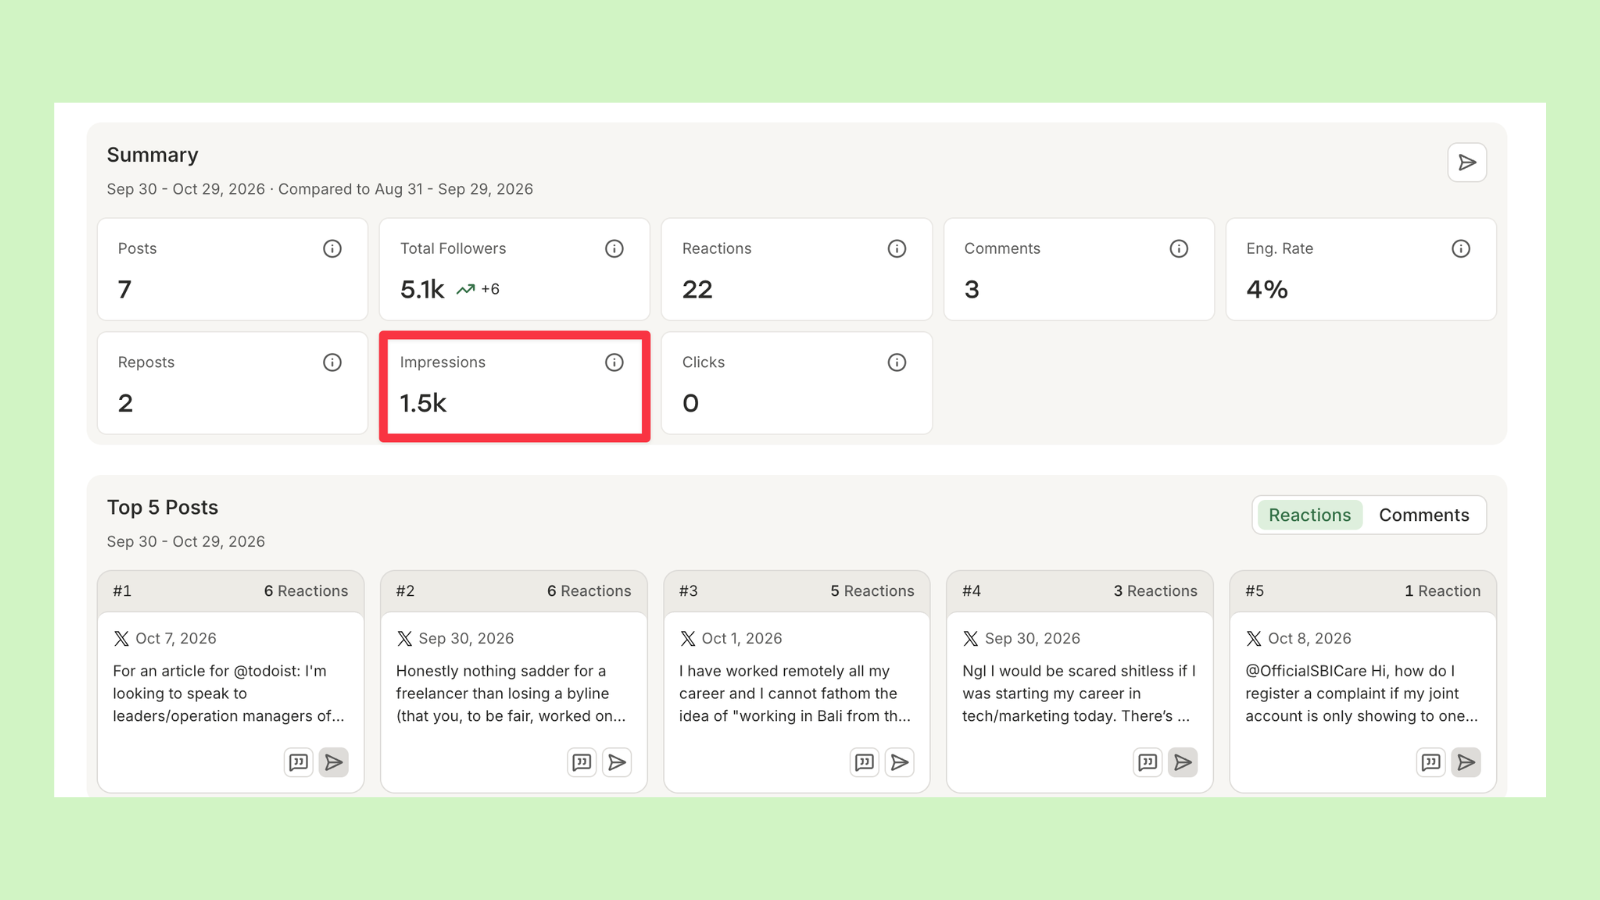
Impressions represent the total number of times a post has been displayed in a user’s feed or search results. This metric is the primary indicator of content visibility. A surge in impressions is typically correlated with high-relevance content or engagement spikes that trigger algorithmic promotion. Monitoring impressions over time—rather than in isolation—allows users to distinguish between viral anomalies and consistent, long-term reach.
2. Engagement Rate
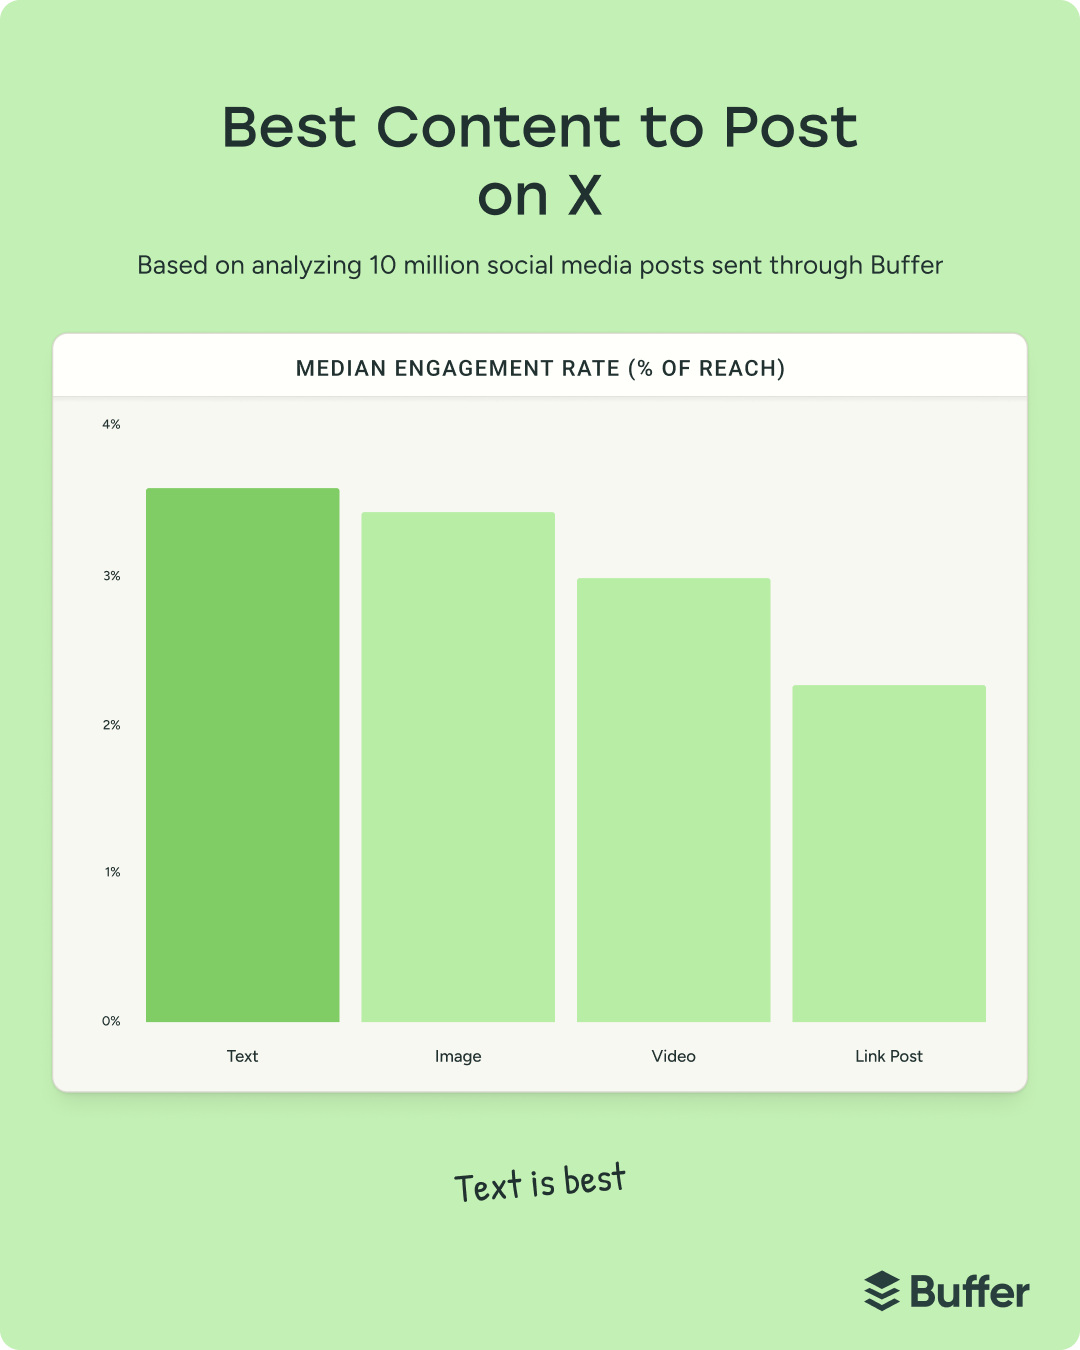
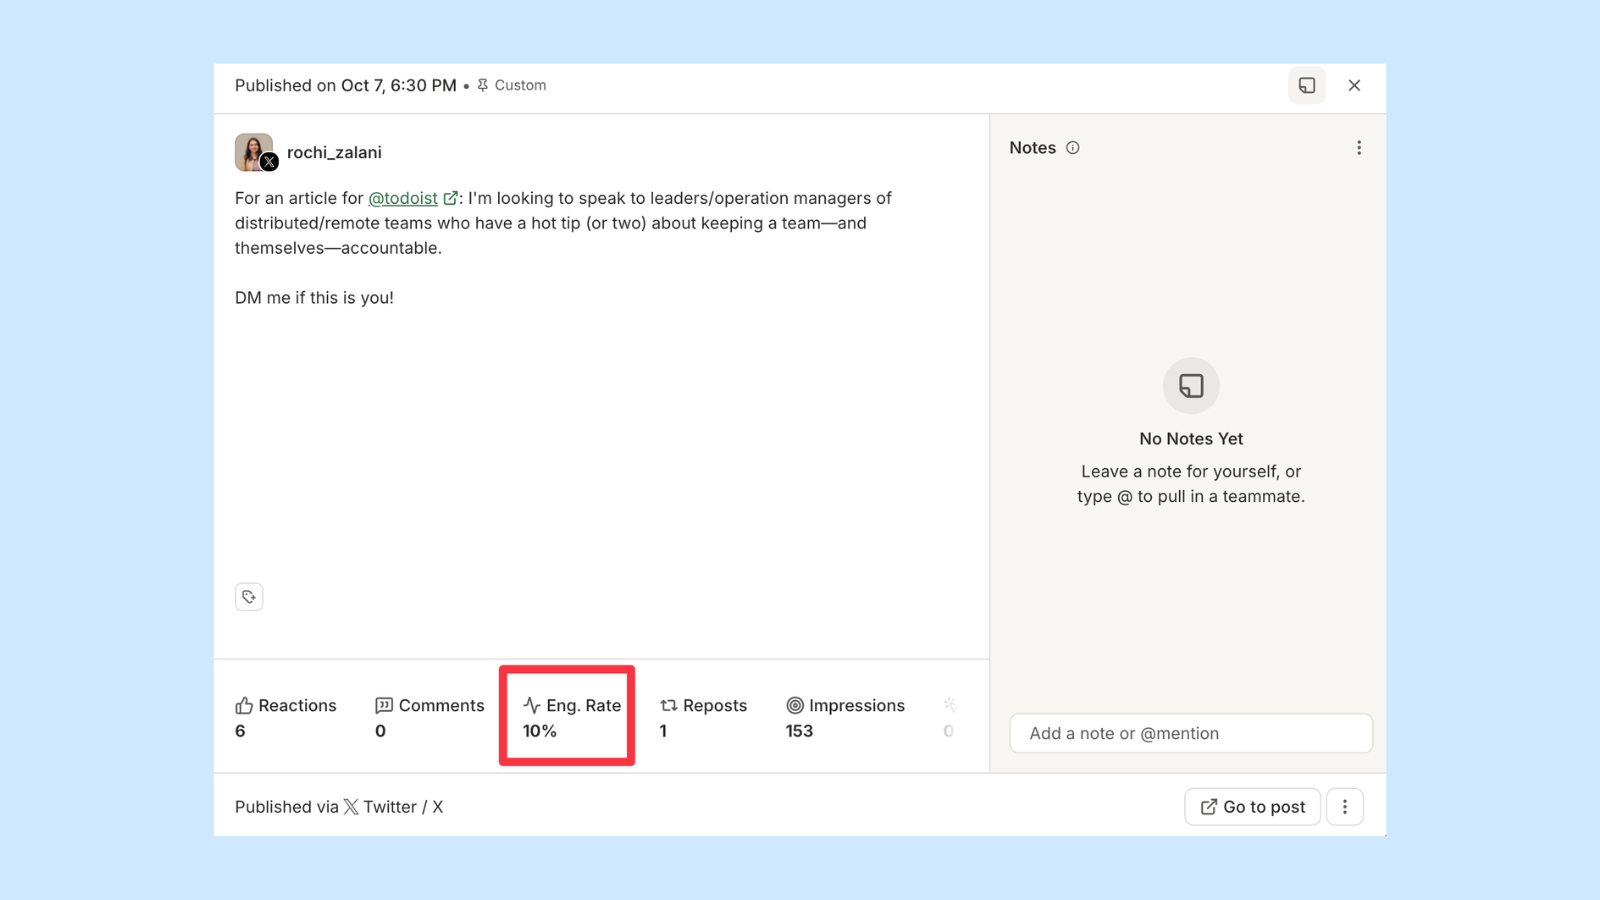
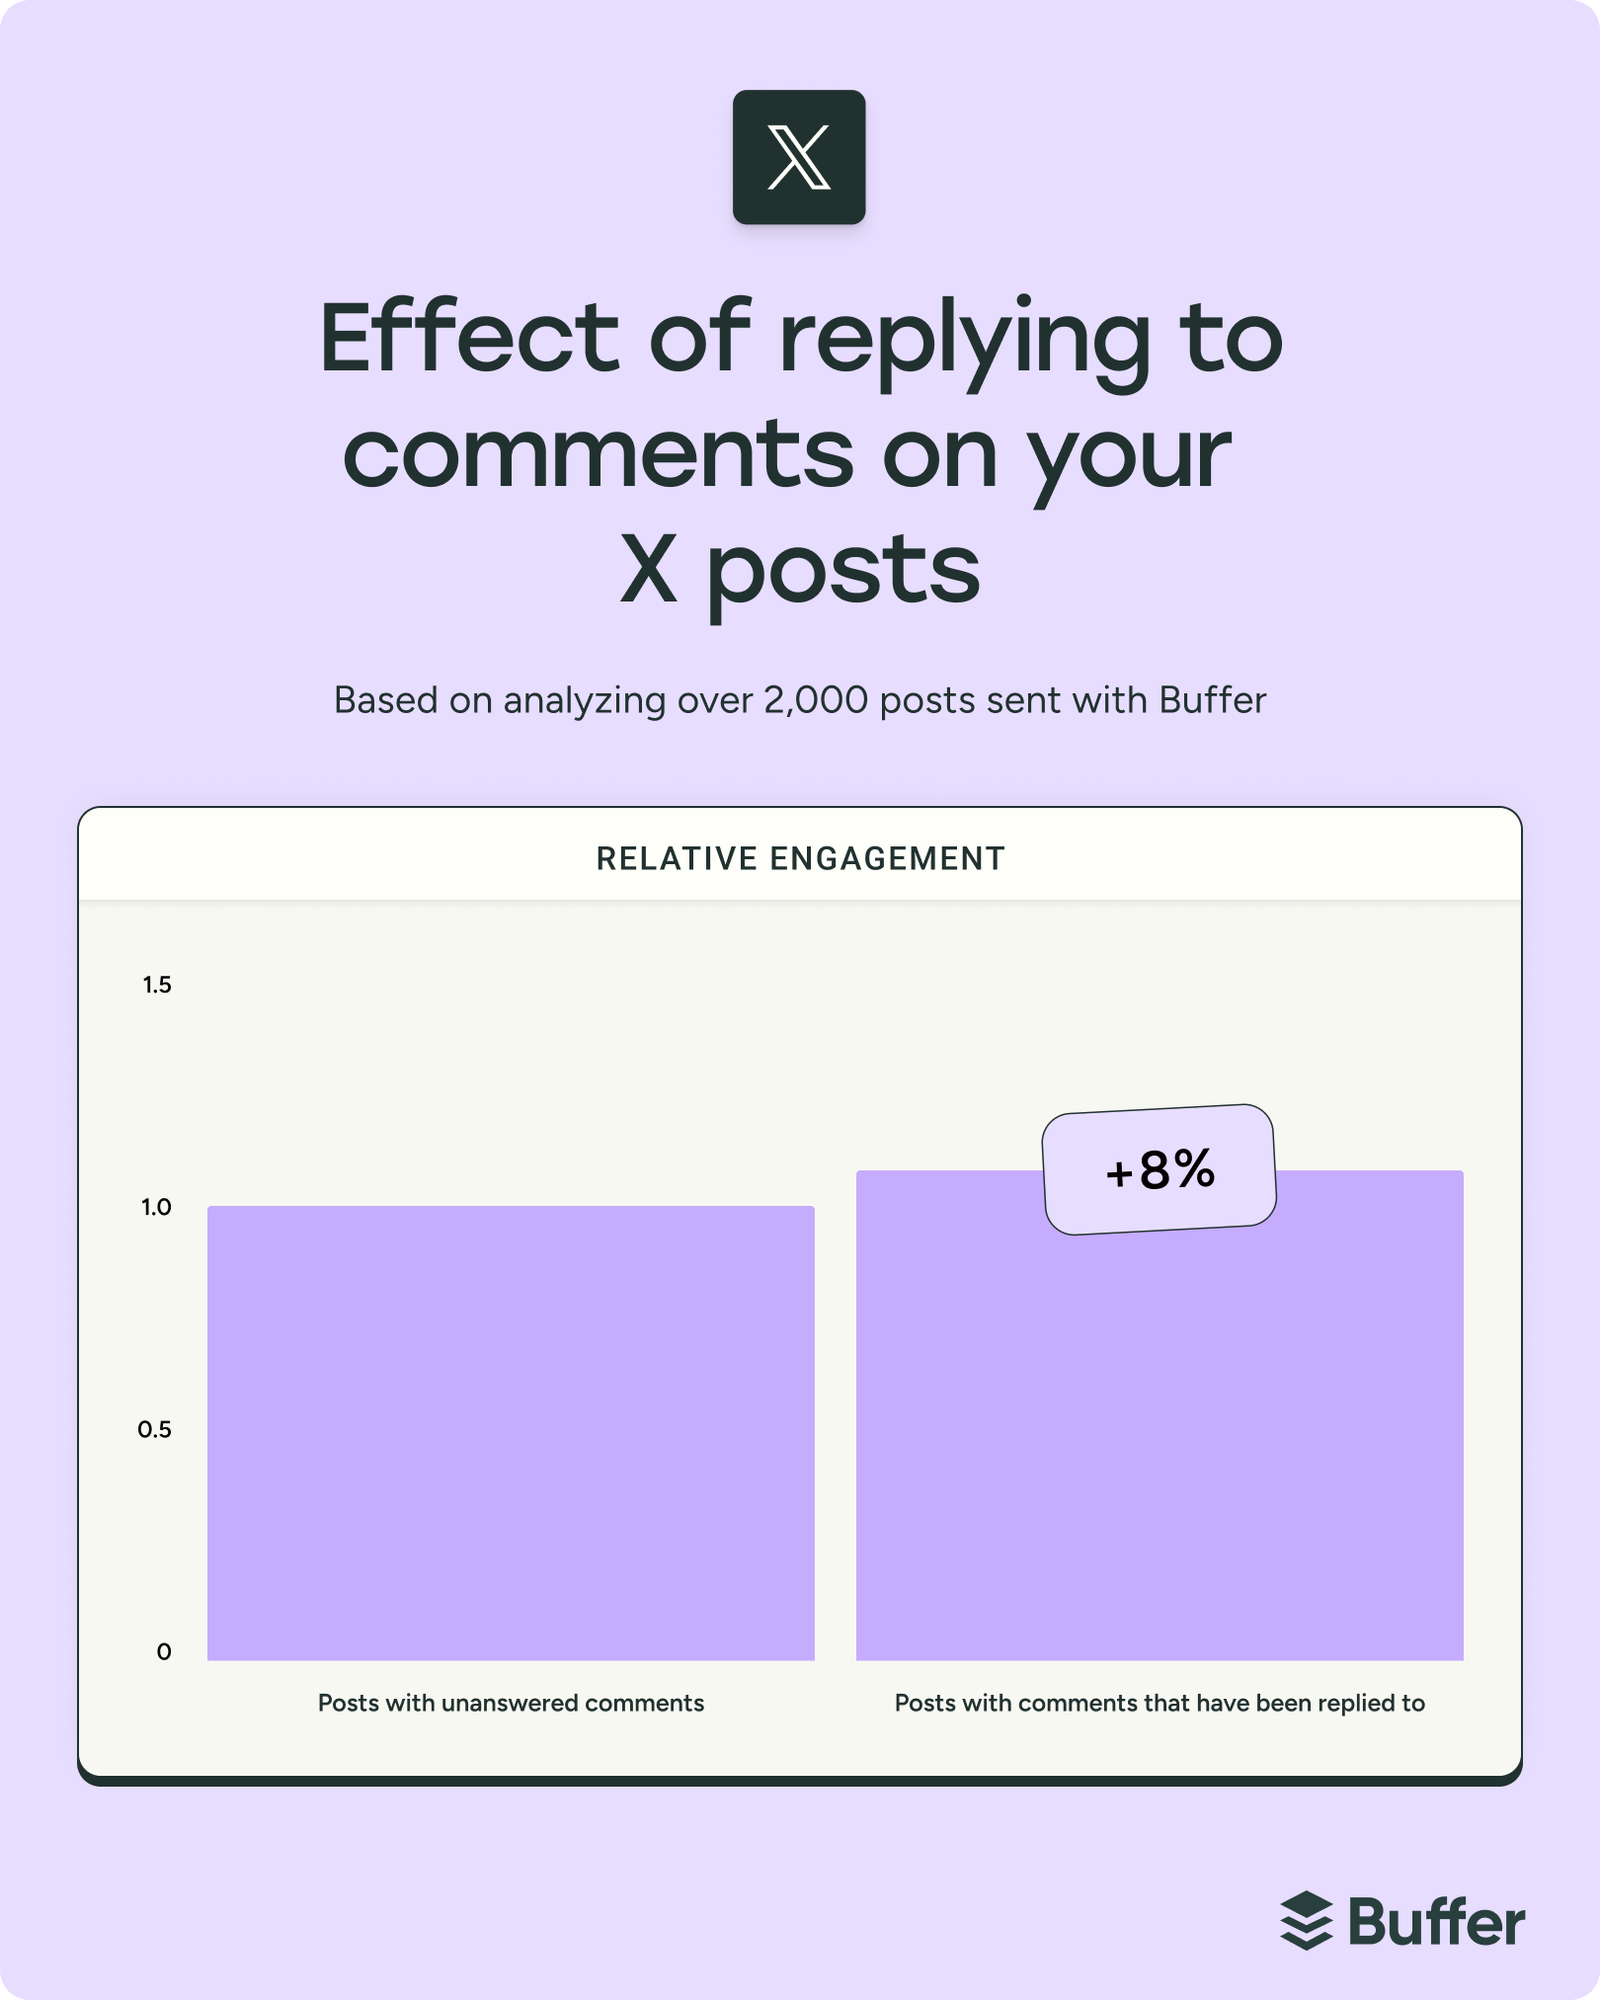
The engagement rate is arguably the most critical health metric for any account. It measures the percentage of users who, upon seeing a post, took an action—whether that be a reply, a repost, a bookmark, or a profile click. Current industry benchmarks suggest that text-only posts frequently achieve the highest median engagement rates, often hovering near 3.56%, followed closely by image-centric posts. Understanding the specific nature of these engagements is vital: for instance, a high volume of "detail expands" indicates that content is compelling enough to warrant further investigation, even if the user does not leave a public comment.
3. Follower Growth Dynamics
Follower growth is the ultimate barometer of an account’s value proposition. By mapping follower acquisition against specific posting schedules and content themes, users can identify the "content pillars" that resonate most effectively with their target demographic. Data consistently demonstrates that consistency is the primary driver of growth; accounts that maintain a steady posting cadence typically experience five times higher engagement than those that exhibit "burst" behavior.
Comparative Analysis: Native Tools vs. Third-Party Integration
The decision to use native analytics versus third-party management software hinges on the scale of an organization’s operations and the diversity of their digital footprint.
For users who focus exclusively on X, the native Premium analytics dashboard offers a high degree of specificity, particularly regarding audience demographics like geographic location, age, and device usage. These insights are indispensable for those engaged in influencer marketing or brand partnerships, as they provide the data necessary for professional media kits.
Conversely, for power users who manage multiple social media channels—such as LinkedIn, Instagram, and Facebook—third-party tools like Buffer offer a centralized command center. The primary advantage here is the consolidation of data. By aggregating performance metrics across platforms, these tools allow for the creation of unified reports, which can be exported as branded PDFs. Furthermore, these platforms often provide "automated insights," which interpret raw data to offer actionable suggestions, such as optimal posting times or content gaps, effectively removing the burden of manual spreadsheet analysis.
Establishing a Data-Driven Workflow
For those beginning their journey into analytics, the most effective approach is to implement a monthly audit. Start by isolating one primary objective: brand awareness (tracked via impressions), community building (tracked via engagement rates), or growth (tracked via follower acquisition).
Chronology of a Data Audit:
- Week 1: Establish a baseline. Record the average number of impressions and engagement rates for the previous month.
- Week 2: Identify high-performing content. Note which topics or formats (video, text, link) triggered the most significant engagement.
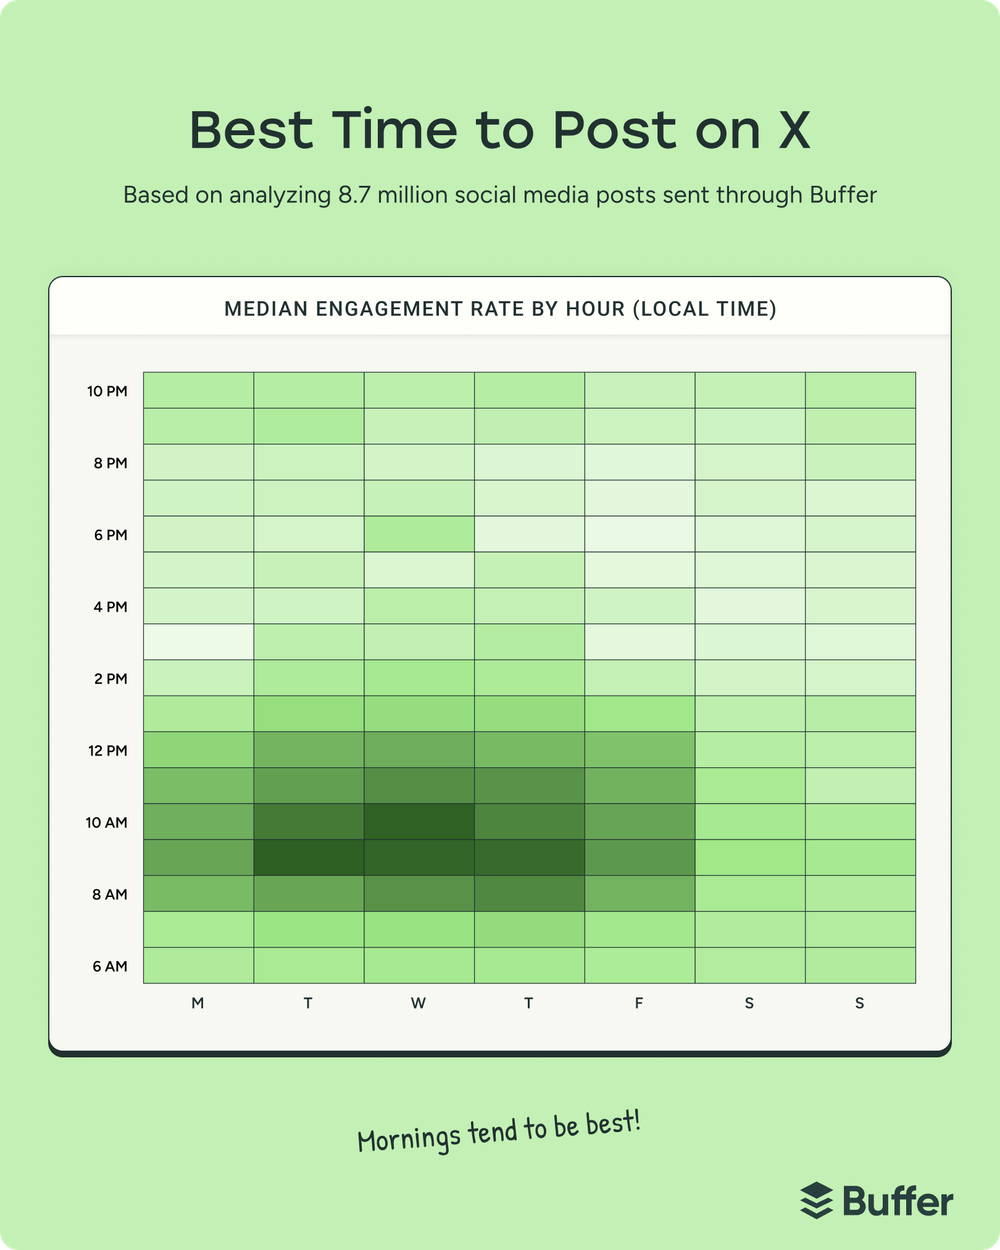
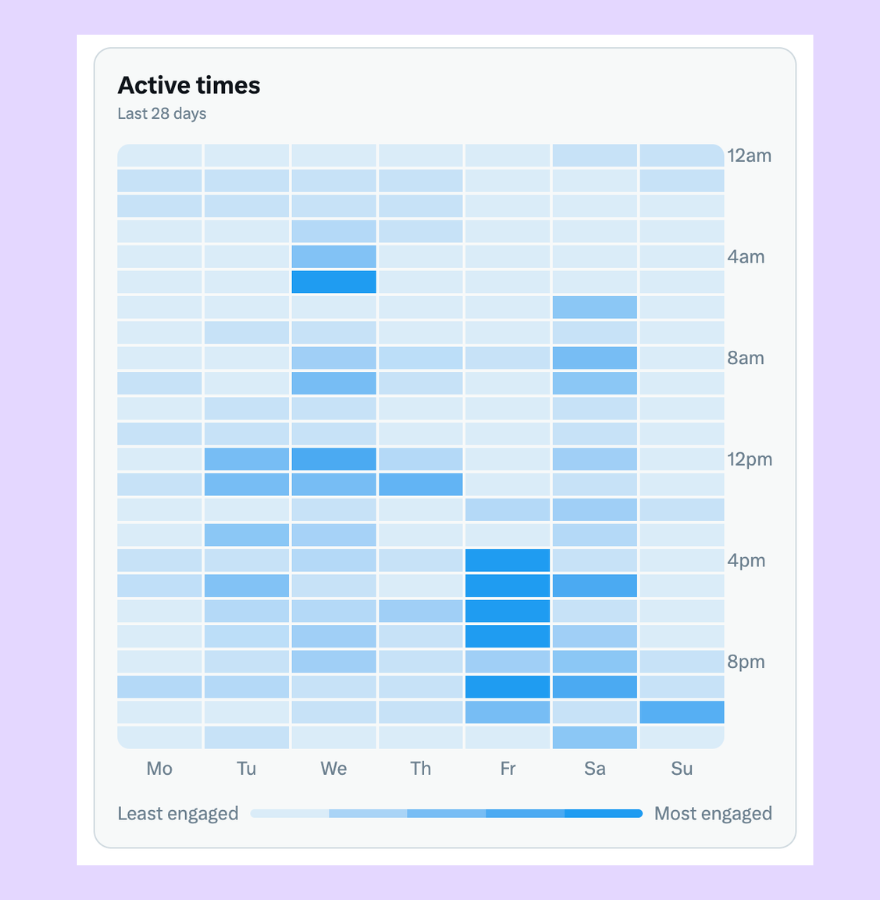
- Week 3: Experiment. Adjust posting times to align with the peak activity hours identified in the analytics dashboard.
- Week 4: Evaluate. Compare the new data against the baseline established in Week 1.
This iterative process transforms the analytics dashboard from a repository of passive numbers into an active engine for strategic improvement.

The Broader Implications for Digital Strategy
The restriction of granular data on X has inadvertently fueled a robust ecosystem of third-party analytics providers. This shift suggests that X is increasingly positioning itself as a premium utility for professional creators, while simultaneously incentivizing the broader community to seek integration with external workflow tools.
For the average user, the takeaway is clear: the platform’s tools are sufficient for basic monitoring, but professional growth requires a more sophisticated approach. Whether through the direct purchase of X Premium or the adoption of external management platforms, the ability to synthesize performance data into a cohesive narrative is the defining skill of the modern digital creator. As the digital landscape continues to fragment, those who prioritize objective, data-driven analysis will be best positioned to navigate the ongoing shifts in algorithmic priorities and audience behavior.
Ultimately, numbers do not lie, but they do require interpretation. By focusing on the intersection of reach, interaction, and growth, users can move beyond the unpredictability of social media trends and build a resilient, audience-centric presence on X.