The Evolution of Data Integration
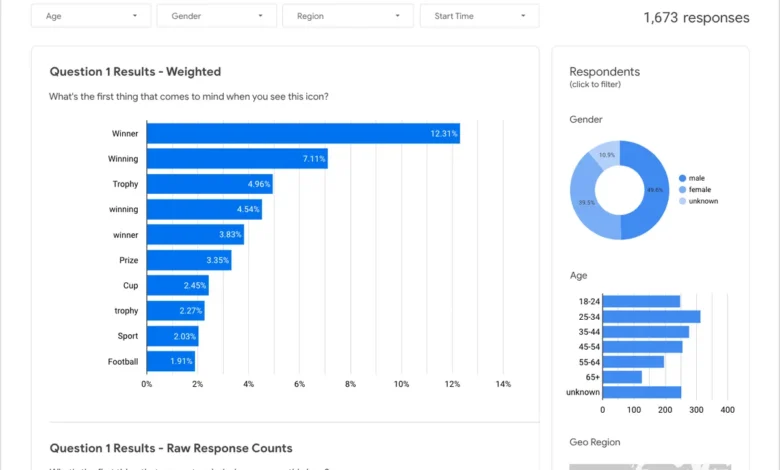
Data Studio, Google’s cloud-based business intelligence and data visualization tool, was designed to democratize data access. Before these updates, the platform already boasted over 300 data connectors, ranging from internal CRM systems and Google Ads to BigQuery data warehouses. However, the disconnect between qualitative market research—often captured in surveys—and quantitative behavioral data from web analytics remained a bottleneck.
Historically, market research was treated as a siloed activity. Teams would conduct surveys to understand consumer sentiment or brand perception, while digital analytics teams tracked conversion funnels and user journeys. Reconciling these two views required hours of spreadsheet manipulation. The new integration allows for a seamless pipeline: survey results are piped directly into visual dashboards alongside performance metrics from Google Ads, providing a holistic view of the customer lifecycle.

Google Analytics 4: A Paradigm Shift
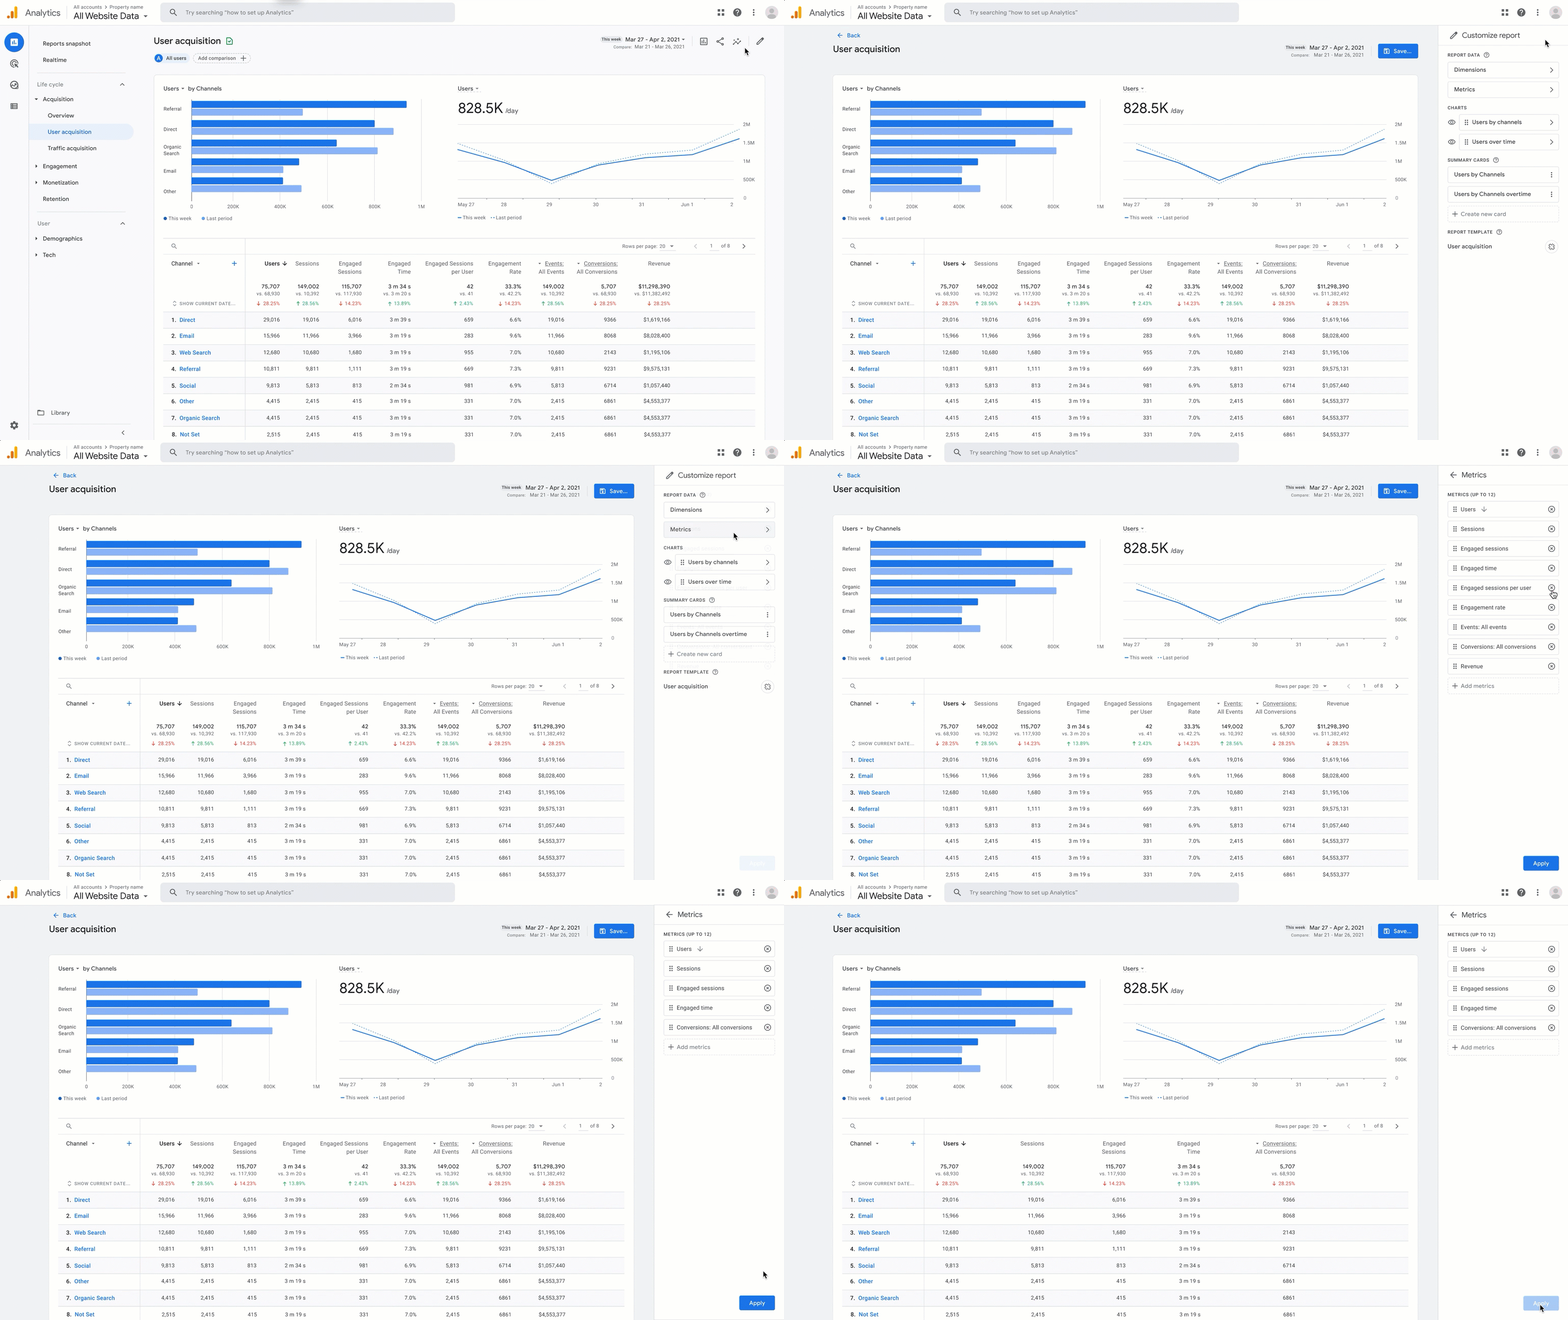
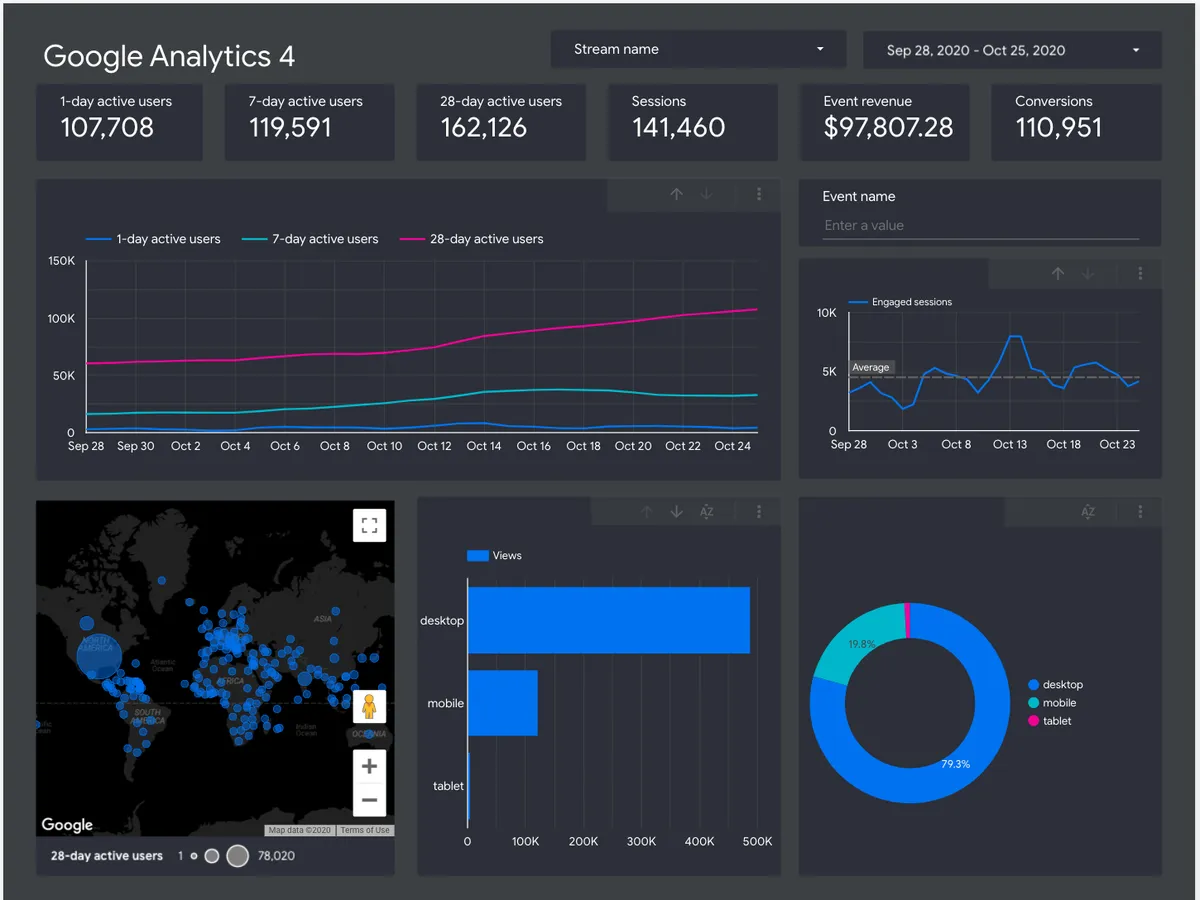
The introduction of support for Google Analytics 4 (GA4) within Data Studio marks a pivotal shift in the industry. Unlike its predecessor, Universal Analytics, which was session-based and focused on page views, GA4 is event-based and designed for cross-platform measurement. This transition reflects the modern reality of user behavior, where a single customer may interact with a brand through a mobile app, a website, and various social media touchpoints.
By enabling GA4 connectivity, Data Studio users can now build reports that track the entire user journey, leveraging the predictive capabilities and advanced machine learning models inherent in GA4. This integration allows organizations to visualize complex event tracking, cross-domain user journeys, and engagement metrics in real-time, effectively bridging the gap between raw data collection and executive-level reporting.
Strategic Importance of Google Surveys Integration
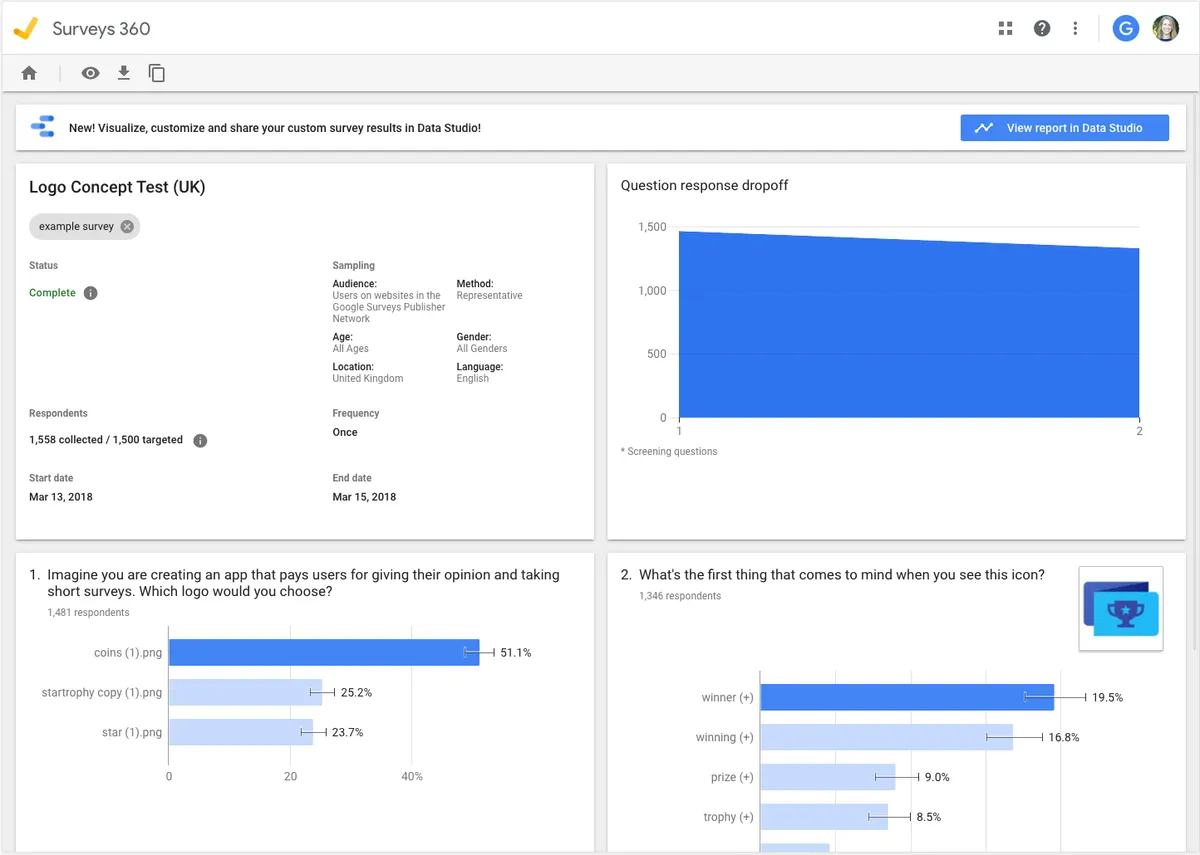
Google Surveys, a tool that provides quick, cost-effective access to consumer insights, has long been a staple for rapid market testing. The new connector removes the manual labor of data ingestion. By clicking "View report in Data Studio" within the Surveys interface, a user can instantly populate a pre-built template. This automation allows for "agile market research," where product managers and marketers can pivot strategies based on immediate feedback loops.
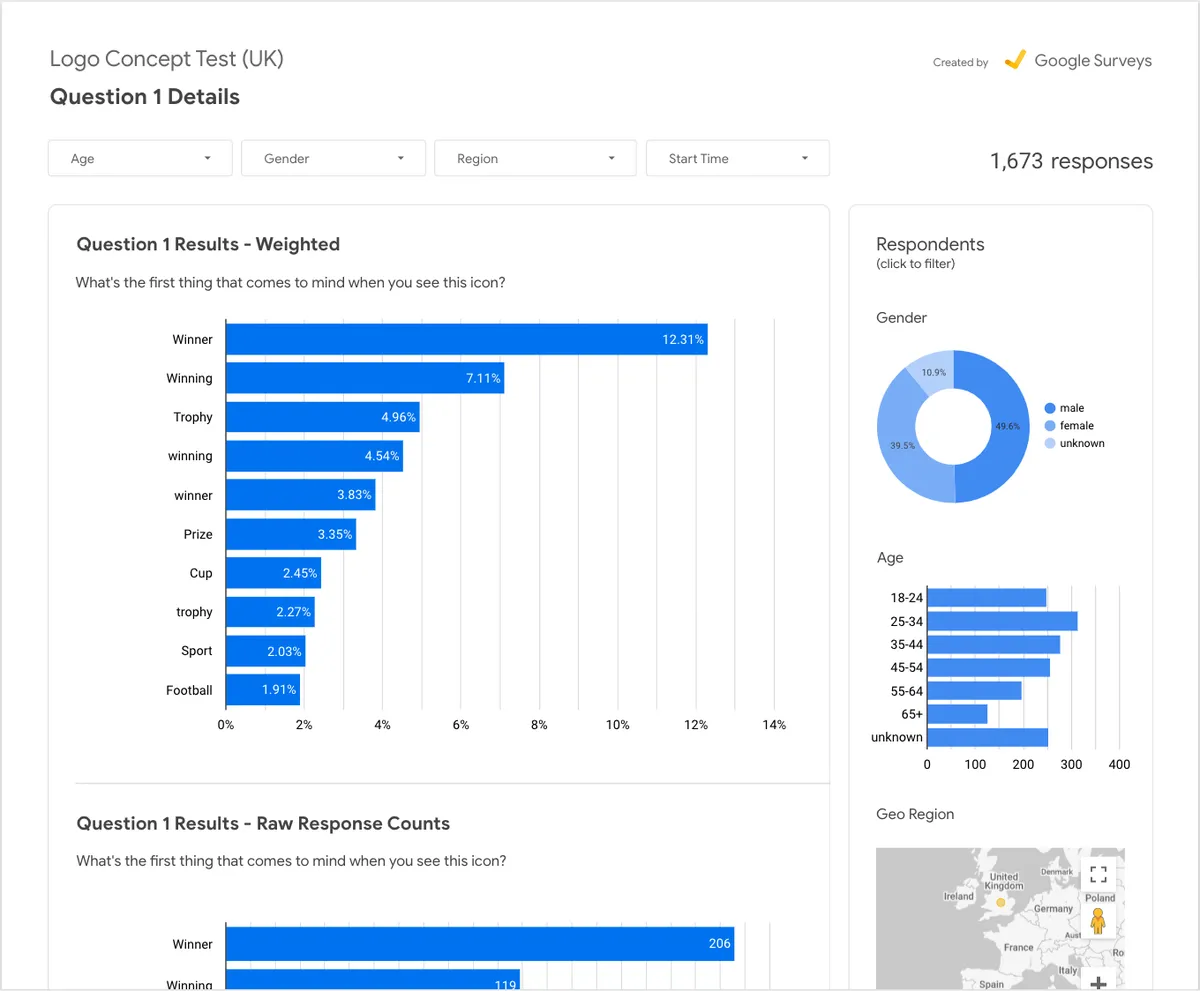
The ability to visualize survey data alongside marketing ROI metrics—such as Cost Per Acquisition (CPA) or Return on Ad Spend (ROAS)—provides a richer narrative for stakeholders. For instance, if a specific demographic reports a low brand affinity in a survey, analysts can immediately cross-reference this with the conversion rates of that same demographic in Google Ads to determine if the issue is one of brand perception or a failure in the sales funnel.
Chronology and Development Timeline
The integration of these services follows a period of rapid acceleration in Google’s data suite development. Throughout 2020, as the global pandemic shifted consumer behavior toward digital-first interactions, the demand for sophisticated, remote-accessible reporting tools spiked.
- Early 2020: Increased demand for remote collaboration tools prompted Google to prioritize the usability of its visualization suite.
- October 2020: The official rollout of the Google Surveys and GA4 connectors to the Data Studio library.
- Post-Launch: The expansion of the Solution Gallery, which now hosts over 30 standardized templates designed to accelerate time-to-insight for common marketing scenarios.
This timeline demonstrates a proactive response to the evolving needs of digital marketers who, during the economic volatility of the early 2020s, required more granular, high-velocity data to justify marketing expenditures.
Supporting Data and Industry Context
Industry research consistently suggests that data silos are a leading cause of operational inefficiency. A report by Forrester Research previously indicated that as much as 60% to 73% of all data within an enterprise goes unused for analytics. The primary barrier identified by these firms is the difficulty in integrating disparate data sources.
By offering 300+ connectors and pre-built templates, Google is effectively lowering the barrier to entry for small and medium-sized enterprises (SMEs) that lack dedicated data engineering teams. The templates available in the Data Studio gallery serve as a "jumpstart" kit. For example, a new user can deploy a high-fidelity Google Ads performance report in minutes, which would otherwise take a skilled analyst several days to build from scratch.
Implications for Marketing and Business Intelligence
The implications of this integration are three-fold:
- Operational Efficiency: Reducing the time spent on "data janitorial work"—cleaning and formatting data—allows teams to shift focus to high-value activities like statistical analysis and hypothesis testing.
- Enhanced Storytelling: Data visualization is as much about communication as it is about mathematics. By providing intuitive, customizable templates, Google ensures that marketing teams can present complex data sets to non-technical stakeholders in a digestible format.
- Holistic Decision Making: The convergence of qualitative survey data and quantitative behavioral data allows for "contextual intelligence." Marketers no longer have to guess why a metric dropped; they can compare the "what" (GA4 data) with the "why" (Surveys).
Future Outlook and Community Feedback
Google has maintained a strategy of continuous improvement, heavily reliant on user feedback via their community forums. The company’s focus on the Solution Gallery indicates a trend toward "productized" analytics—where the platform provides not just the tools, but the methodology for success.
The integration of Google Analytics 4 and Google Surveys is likely just the beginning of a broader trend toward unified, automated reporting. As AI-driven insights become more prevalent, the role of Data Studio will evolve from a static dashboarding tool into an active participant in the decision-making process, potentially highlighting anomalies or trends without human intervention.
Conclusion
The expansion of Data Studio’s capabilities represents a commitment to the modern marketer’s need for agility and depth. As organizations navigate an increasingly complex digital landscape, the ability to aggregate, visualize, and act upon data from multiple streams will determine competitive advantage. Through these new connectors, Google has provided a streamlined path to achieving that clarity. For those tasked with proving the efficacy of marketing investments, these tools are not merely convenient; they are essential instruments for navigating the future of business intelligence. As the platform continues to grow, the emphasis will undoubtedly remain on reducing the friction between data existence and data utility, ensuring that stakeholders at every level of an organization can derive actionable insights with minimal latency.