

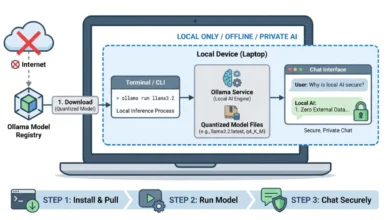
Transport for London (TfL), the statutory body governing the capital’s extensive public transport network, has long embraced an "Open Data" policy. This initiative allows the public access to a wealth of internal data, which TfL states is currently instrumental in powering over 600 applications used by Londoners daily. Among the diverse datasets made available, the usage statistics for the Santander Cycle hire scheme—colloquially known as "Boris Bikes"—offer a particularly granular look into urban mobility patterns.
This rich trove of information meticulously records every single bike journey, with data stretching from 2015 up to a projected 2025. However, accessing this data is not a straightforward affair. It is organized into a series of large, weekly CSV files, presenting a significant data wrangling challenge for any analyst. The repository for this data can be found at https://cycling.data.tfl.gov.uk/#!usage-stats/. Each row in these files represents a unique bike journey, originating from a specific docking station. Cumulatively, this dataset encompasses an astonishing 9.2 million station-hours of usage, spread across approximately 800 bike stations and compiled into 144 weekly CSV files. A glimpse into the raw data reveals key details for each trip:
| Start Date | StartStation Name | End Date | EndStation Name | Duration (seconds) |
|---|---|---|---|---|
| 10/01/2016 00:00 | Drury Lane, Covent Garden | 10/01/2016 00:04 | Frith Street, Soho | 240 |
| 10/01/2016 00:00 | Pott Street, Bethnal Green | 10/01/2016 00:05 | Victoria Park Road, Hackney Central | 300 |
| 10/01/2016 00:00 | Harrington Square 2, Camden Town | 10/01/2016 00:20 | Baylis Road, Waterloo | 1200 |
| 10/01/2016 00:01 | Canton Street, Poplar | 10/01/2016 00:14 | Hewison Street, Old Ford | 780 |
| 10/01/2016 00:01 | Cephas Street, Bethnal Green | 10/01/2016 00:11 | Brick Lane Market, Shoreditch | 600 |
By aggregating this granular journey data, analysts can begin to discern broader trends, such as the seasonality of bike usage across London.
Unpacking the Impact of Disruptions: The Case of Tube Strikes
For those interested in causal data science, the Santander Cycle data presents a compelling opportunity to investigate the real-world impact of significant events on urban behaviour. The central question arises: what external factors cause notable fluctuations in cycling trips? Beyond weather and seasonal patterns, major disruptions to other transport modes, such as London Underground (Tube) strikes, offer a unique scenario for analysis. Strikes, by their nature, represent a deliberate withholding of labour, a powerful mechanism that can force commuters to seek alternative modes of transport.
Investigating the causal effect of major Tube strikes on Santander Cycle usage in London provides a fascinating case study. While pinpointing historical strike dates across the internet can be challenging, a Freedom of Information (FOI) request to TfL (reference FOI-2596-1819) has yielded valuable data. This FOI request details strike action on a line-by-line basis between 2014 and 2018, providing precise temporal markers for our analysis.
Data Transformation: From Raw Journeys to Analyzable Insights
The initial challenge lies in transforming the raw, journey-level data into a format suitable for causal inference. The 144 weekly CSV files are first converted into more memory-efficient Parquet files. These are then consolidated into a single, comprehensive DataFrame. The data is further processed by grouping it by bike station and then by hour, resulting in a structured dataset that captures hourly trip counts per station.
| station_id | trips_start | ts (trip count) |
|---|---|---|
| 1 | 2016-01-10 09:00:00 | 4 |
| 1 | 2016-01-10 10:00:00 | 1 |
| 1 | 2016-01-10 11:00:00 | 2 |
| 1 | 2016-01-10 12:00:00 | 2 |
| 1 | 2016-01-10 13:00:00 | 2 |
To facilitate spatial analysis, TfL also provides precise geographical coordinates for each bike station. These coordinates are integrated with the data, and subsequently, a hexagonal grid system known as H3 (developed by Uber and widely used for spatial analysis) is employed to aggregate data into discrete geographical cells. This spatial aggregation helps in understanding the distribution of bike trips across London, as visualized in the map below, which illustrates the density of cycling activity across different H3 cells.
The data is then aggregated to the H3 cell-day level, incorporating potential confounding factors that could influence cycling behaviour. These include meteorological data, such as temperature and precipitation, alongside crucial seasonality features like whether a day is a weekend, a bank holiday, or a school holiday. Information regarding the proximity to the next or previous strike is also included to account for temporal proximity effects.
This comprehensive aggregation results in a dataset where each row represents the entirety of Santander bike trips within a specific H3 cell on a given day. The analysis focuses on 172 cells observed over 1,192 days.
Addressing the Positivity Assumption for Credible Causal Inference
A critical assumption in causal inference, known as the "Positivity" or "Overlap" assumption, dictates that every unit must have a non-zero probability of receiving both the treatment and the control. In this context, it is assumed that a commuter unable to use the Tube due to a strike might walk up to 500 meters to access a Santander bike. Therefore, the analysis filters for H3 cells that have at least one Tube station within a 500-meter radius. This ensures that the chosen cells have a reasonable likelihood of being affected by Tube disruptions and subsequently experiencing an increase in bike usage.

This filtering process leads to a refined cell-day dataset comprising 62 H3 cells, with 66,039 rows. Notably, approximately 98.4% of these cells were exposed to strike conditions at some point during the observed period, satisfying the positivity requirement for robust causal analysis.
Defining the Outcome and Treatment Variables
The outcome variable, denoted as $Y_i,t$, is constructed to represent the relative bike usage within each cell. It is defined as the total number of bike trips in cell $i$ on day $t$, divided by the number of bike stations within that cell. To ensure that the analysis focuses on proportional changes and satisfies statistical assumptions, the natural logarithm of $(1 + textusage)$ is taken. The addition of one accounts for cell-days with zero recorded trips, preventing their exclusion from the analysis.
[
Y_i,t = logleft(1 + fractextTotal Bike Trips in cell i text on day ttextNumber of Bike Stations in cell iright)
]
The calculation of this outcome variable in Python is as follows:
cell_day["y_per_station_log1p"] = np.log1p(cell_day["total_trips"] / cell_day["n_stations"])Defining the treatment variable, $T_i,t$, which indicates strike exposure for cell $i$ on day $t$, requires careful consideration. The FOI data provides information on which Tube lines were striking on specific days, but this does not directly map to individual H3 cells. A bike station is considered "strike-affected" if it is located within 400 meters of a Tube station served by a striking line. Subsequently, an H3 cell is deemed "strike-exposed" if it contains at least one such strike-affected bike station.
The treatment variable is formally defined as:
[
T_i,t =
begincases
1, & textif cell i text is strike-exposed on day t
0, & textotherwise
endcases
]
The process of constructing this variable involves mapping strike information to individual stations and then aggregating this to the cell level. A detailed breakdown of this data wrangling process can be found in the accompanying notebook on GitHub: https://github.com/stucsk99/tfl_bike_casual/blob/main/01_data_pipeline.ipynb.
The Causal Mechanism: Substitution in Action
The core causal mechanism driving this analysis is substitution. When Tube lines cease operation due to strikes, commuters who would typically rely on the Underground are compelled to seek alternative transportation. For individuals situated near major Tube interchange stations, Santander Cycles present a readily accessible and practical substitute. They are available without prior registration, priced for short urban journeys, and conveniently located at stations where displaced commuters emerge. This substitution narrative forms the credible causal pathway connecting the treatment (strike exposure) to the outcome (increased bike trips).
The chain of events is as follows: a strike occurs, disrupting Tube travel; displaced commuters actively seek alternatives; some opt to walk to a nearby Santander Cycle dock; consequently, bike trips increase. Each link in this chain represents a step in the causal mechanism, providing a rationale for believing that observed statistical correlations are indicative of a real-world effect. This mechanism can be visualized through a structural causal model, illustrating the interconnectedness of strike action, commuter behaviour, and cycling patterns.
The timing of strikes, determined by labour negotiations rather than by factors influencing cycling demand, provides strong grounds for believing that strike days are not systematically different from non-strike days in ways that would independently affect bike usage. A strike called on a specific Tuesday in January is a consequence of failed wage negotiations, not an indicator of unusually favorable or unfavorable cycling conditions on that particular day. This makes the counterfactual comparison—what would have happened on strike days if the strike had not occurred—credible.

The Potential Outcomes Framework: Understanding Causality
The fundamental challenge in causal inference is the inability to observe counterfactual outcomes. For any given unit (in this case, a cell-day), we can only observe one of two potential outcomes: either the outcome under treatment (strike) or the outcome under control (no strike). This is encapsulated by the potential outcomes framework.
Let $Yi,t(0)$ represent the potential outcome for cell $i$ on day $t$ if no strike occurred, and $Yi,t(1)$ represent the potential outcome if a strike did occur. The individual treatment effect for cell $i$ on day $t$ is the difference between these two potential outcomes:
[
taui,t = Yi,t(1) – Y_i,t(0)
]
While we cannot observe this individual effect directly, we can aim to estimate population-level effects. The Average Treatment Effect (ATE) is the expected treatment effect for a randomly selected unit from the population:
[
ATE = E[Yi,t(1) – Yi,t(0)] = E[tau_i,t]
]
This quantifies the expected change in log bike trips per station for a randomly selected cell-day if it were to experience a strike.
A related concept is the Average Treatment Effect on the Treated (ATT):
[
ATT = E[Yi,t(1) – Yi,t(0) | Di = 1] = E[taui,t | D_i = 1]
]
Where $D_i$ is the treatment indicator. ATT focuses on the effect experienced by units that were actually exposed to the treatment—in this case, cell-days that were indeed strike-exposed.
The Pitfalls of Naive Estimation: Selection Bias
A naive approach to estimating the ATE would be to simply compare the average outcome for treated units with the average outcome for control units:
[
tau^textnaive = overlineYD=1 – overlineYD=0
]

An initial calculation using the provided data yields a naive difference of approximately +5.5%. This suggests that cells experiencing any strike exposure have substantially higher log bike trips per station compared to those without. However, this is not a credible causal estimate due to selection bias.
The naive difference can be algebraically decomposed as:
[
overlineYD=1 – overlineYD=0 = underbrace Di = 1]textATT + underbraceE[Y_i,t(0) textselection bias
]
The second term, selection bias, represents the difference in control potential outcomes between treated and untreated units. In this London context, cells that are strike-exposed are likely to be located in central, densely populated areas with high Tube connectivity. These areas also tend to have higher baseline bike usage irrespective of any strikes. Consequently, the naive estimate conflates the true effect of strikes with the inherent advantage of centrally located cells. The subsequent analytical methods aim to eliminate this selection bias.
Leveraging Panel Data for Robust Causal Inference
The structure of the dataset, observing the same units (H3 cells) repeatedly over time (days), is that of panel data. This structure is particularly well-suited for addressing selection bias. The general form of panel data is $ Xi,t, Di,t, Y_i,t $, where $i$ indexes the unit (H3 cell) and $t$ indexes the time period (day).
The key advantage of panel data is its ability to disentangle time-invariant characteristics of a unit from time-varying factors. For instance, a cell’s proximity to a major transport hub is a permanent feature, whereas daily fluctuations in bike usage can be influenced by strikes, weather, or other daily events. Panel methods allow us to account for these time-invariant cell-specific attributes without needing to explicitly measure them.
The Two-Way Fixed Effects Model: Controlling for Unobserved Heterogeneity
To estimate the causal effect while controlling for selection bias and other confounding factors, a two-way fixed effects (TWFE) model is employed. This approach is a generalization of traditional difference-in-differences methods and is set up as follows:
[
Yi,t = alphai + lambdat + tauDi,t + beta Xi,t + epsiloni,t
]
Here:
- $Y_i,t$ is the outcome variable for cell $i$ on day $t$.
- $alpha_i$ represents the cell-specific fixed effect, capturing all time-invariant characteristics of cell $i$.
- $lambda_t$ represents the day-specific fixed effect, capturing common shocks or trends affecting all cells on day $t$.
- $tau$ is the causal treatment effect we aim to estimate.
- $D_i,t$ is the treatment indicator (strike exposure).
- $beta$ are the coefficients for covariates $X_i,t$ (e.g., weather, holidays).
- $epsilon_i,t$ are the error terms.
The inclusion of both cell and day fixed effects effectively controls for time-invariant cell characteristics and common day-level shocks, thereby mitigating selection bias and confounding. This model can be implemented using standard statistical software.
# Assuming 'cell_day' is the DataFrame and 'date_str' is a string representation of the date
twfe = smf.ols(
    """y_per_station_log1p ~ treated
       + temperature_2m + precipitation
       + is_weekend + is_bank_holiday + is_school_holiday
       + days_to_next_strike + days_since_last_strike
       + C(h3_cell) + C(date_str)""",
    data=cell_day,
).fit(
    cov_type="cluster",
    cov_kwds="groups": cell_day["h3_cell"],
)
Crucially, standard errors are clustered at the cell level. This accounts for the potential correlation of residuals within the same cell across different days, which is essential for accurate statistical inference in panel data.

Refined Analysis: Focusing on Centrality and Temporal Proximity
To strengthen the causal argument and refine the analysis, further data filtering is applied. The initial selection of cells within 500 meters of a Tube stop (satisfying the positivity assumption) is augmented by a more targeted approach. The analysis focuses on 42 major Tube interchange stations in Central London (e.g., Bank, Liverpool Street, King’s Cross, Waterloo, Victoria). These are identified as key locations where commuter displacement is most likely to lead to increased Santander Cycle usage due to high commuter density and proximity to bike docks.
Cells within 800 meters of these 42 central stations are selected. This restriction concentrates the analysis on geographic areas where both the demand shock from a strike and the supply response from the bike network are most concentrated, thereby enhancing the signal-to-noise ratio for the substitution effect.
Furthermore, to address potential confounding from broader seasonal trends and to isolate the impact of strikes more effectively, the analysis is restricted to a temporal window of 45 days surrounding each strike date. This ensures that the control days are more comparable to the treated days, reducing the influence of unrelated seasonal variations.
This progressive refinement leads to different basefile versions:
| Basefile Version | Rows | Treatment % |
|---|---|---|
| Only cells within 500m of tube stop | 66,039 | 0.82 |
| Only cells close to Central Stations | 34,590 | 0.94 |
| Only days within 45 days of strike days | 16,799 | 1.95 |
Results and Implications
The refined TWFE model, applied to the most causally potent dataset (focusing on central stations and temporal proximity), estimates an increase in Santander Cycle usage of approximately 3.95% on strike days. The associated p-value is 0.097. While this p-value is slightly above the conventional 0.05 threshold, the consistently positive estimates across different model specifications and the confidence intervals suggest a real, albeit potentially modest, effect.
The analysis highlights that even with robust causal inference methods, real-world data presents complexities. Data wrangling challenges, such as reconciling inconsistent column schemas and correcting identifier mismatches, are inherent in working with open data. Furthermore, the choice of analytical method is critical; while machine learning techniques like meta-learners could estimate conditional average treatment effects (CATEs), a panel data fixed effects regression is better suited for this specific problem due to its ability to handle time-invariant characteristics and recurring binary treatments.
Causal Inference Assumptions and Limitations
For the TWFE estimate to hold causal validity, several key assumptions must be met:
- Positivity/Overlap: Addressed by ensuring all analyzed cells have a non-zero probability of being exposed to strikes (i.e., proximity to Tube stations).
- Parallel Trends: The assumption that, in the absence of strikes, treated and control cells would have followed similar trends in bike usage. This is plausible as strike timing is driven by labour negotiations, not underlying cycling demand patterns.
- No Anticipation: The assumption that behavior does not change before a strike occurs. The inclusion of covariates like "days_to_next_strike" helps to mitigate this, and unannounced strikes inherently satisfy this assumption.
- SUTVA (Stable Unit Treatment Value Assumption): The potential outcomes of one cell should not depend on the treatment status of other cells. This assumption may be violated, as strikes can displace commuters across a wide area, potentially affecting bike usage in cells not directly adjacent to striking lines. Such violations would likely attenuate the estimated effect, suggesting the +3.95% is a lower bound for the most directly affected cells.
Conclusion: A Modest Boost for Bikes During Disruptions
In conclusion, the analysis of TfL’s open data on Santander Cycle usage strongly suggests that London Tube strikes do indeed lead to an increase in bike hire. While the journey from raw data to a credible causal estimate is fraught with challenges, the application of robust causal inference techniques, particularly the two-way fixed effects model on carefully curated data, points to a statistically significant, albeit modest, boost in bike usage during periods of Tube disruption. This research underscores the value of open data and sophisticated analytical approaches in understanding the complex interplay of urban mobility, public transport, and behavioral responses to major disruptions. The findings offer valuable insights for urban planners and transport authorities in anticipating and managing the consequences of future industrial action.


