
Tracking social media KPIs is crucial for understanding your online presence and optimizing your strategies. This guide dives deep into the world of social media key performance indicators (KPIs), exploring various metrics from engagement and reach to conversions and ROI. We’ll analyze how different platforms, like Twitter, Instagram, and Facebook, utilize these KPIs and discuss practical methods for measuring and interpreting them.
From understanding engagement metrics to analyzing website traffic driven by social media, we’ll cover all the essential elements for crafting a powerful social media strategy.
This in-depth exploration will cover everything from defining essential KPIs to creating actionable reports. You’ll learn how to interpret data, identify trends, and ultimately use these insights to improve your social media performance. We’ll delve into practical strategies and tools for measuring your success, empowering you to make data-driven decisions that maximize your social media impact.
Measuring Social Media Engagement
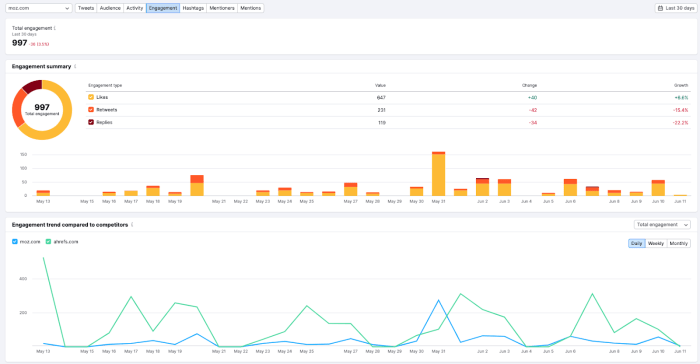
Understanding and tracking social media engagement is crucial for gauging the effectiveness of your social media strategy. Engagement metrics provide insights into audience interaction, content resonance, and overall brand perception. By analyzing these metrics, you can identify what content resonates best with your target audience and adjust your approach accordingly. This allows for optimized resource allocation and a more effective social media presence.Engagement rates are not static; they fluctuate based on various factors.
Monitoring these fluctuations allows for a more dynamic approach to content creation and scheduling. This dynamic approach, in turn, leads to better engagement and potentially higher returns. A consistent and detailed tracking system can identify patterns and trends, offering valuable information for strategy refinement.
Methods for Measuring Engagement Metrics
Different metrics provide unique insights into audience interaction. Likes, comments, and shares are common indicators of content popularity and audience interest. Monitoring these metrics allows for a deeper understanding of content effectiveness and audience preferences. Tools like social media analytics platforms and spreadsheets can be used to consolidate and analyze this data, providing a clear picture of overall engagement.
Tracking and Analyzing Engagement Rates Over Time
Tracking engagement over time reveals trends in audience interaction. This allows you to observe patterns in how your audience interacts with your content, identifying periods of higher or lower engagement. By analyzing these trends, you can refine your content strategy and schedule posts for optimal impact. Tools for this include spreadsheets, social media analytics dashboards, and custom reporting.
Identifying Trends in Engagement Levels
Analyzing engagement trends helps in understanding audience behavior and preferences. By identifying patterns, you can adapt your content strategy to better meet audience needs. For example, noticing higher engagement during specific days or times can help you schedule posts for optimal visibility. This information also helps to understand the effectiveness of different types of content.
Table of Engagement Metrics and Formulas
| Metric | Formula | Description |
|---|---|---|
| Engagement Rate | (Total Engagement / Total Impressions) – 100 | Measures the overall interaction with your content. |
| Like Rate | (Number of Likes / Total Impressions) – 100 | Shows the percentage of impressions resulting in likes. |
| Comment Rate | (Number of Comments / Total Impressions) – 100 | Indicates the percentage of impressions resulting in comments. |
| Share Rate | (Number of Shares / Total Impressions) – 100 | Reflects the percentage of impressions resulting in shares. |
Tracking and Analyzing Engagement from Different Content Types
Different content types (images, videos, text posts) often elicit varied engagement levels. Analyzing engagement from each content type allows you to identify which types perform best with your audience. This can inform future content creation choices. For example, videos might have higher engagement rates compared to text posts, while images might perform better than longer-form articles.
Tracking Reach and Impressions: Tracking Social Media Kpis
Understanding how many people see your social media content is crucial for evaluating its effectiveness. Reach and impressions are key metrics that quantify the visibility of your posts. This understanding helps you refine your strategy, optimize content, and ultimately achieve your social media objectives.Reach and impressions provide a snapshot of the audience exposed to your content. By analyzing these metrics, you can identify what resonates with your target audience, optimize posting times, and gauge the overall performance of your campaigns.
This allows you to allocate resources more effectively and make informed decisions about future content strategies.
Methods for Measuring Reach and Impressions, Tracking social media kpis
Each social media platform provides built-in tools for tracking reach and impressions. Familiarize yourself with the specific reporting features offered by platforms like Facebook, Instagram, Twitter, and LinkedIn. These platforms offer detailed insights into the demographics of your audience, allowing you to better understand who is engaging with your content. Regularly reviewing these reports allows you to identify patterns and trends in your audience engagement.
Interpreting Reach and Impression Data
Reach represents the unique number of people who saw your content at least once. Impressions, on the other hand, indicate the total number of times your content was displayed. A high reach with low impressions could suggest your content is being shown to a limited audience, while a low reach with high impressions might point to content that is getting visibility but not attracting the intended audience.For example, if a post has a reach of 10,000 and 50,000 impressions, it means the content was seen by 10,000 unique individuals, but displayed to a total of 50,000 people.
This difference highlights the importance of considering both reach and impressions.
Organic vs. Paid Reach
Organic reach refers to the number of people who see your content without any paid promotion. Paid reach, conversely, represents the number of people exposed to your content through paid advertising campaigns. Understanding the difference between organic and paid reach is essential for assessing the effectiveness of your content strategy and the return on investment (ROI) of your advertising efforts.
Organic reach demonstrates the natural engagement with your content, while paid reach focuses on targeted advertising.
Tracking social media KPIs is crucial, but what if you could supercharge engagement? Implementing push notifications, like those discussed in this insightful article on push notifications to boost engagement , can significantly impact your results. Ultimately, measuring the effectiveness of these notifications becomes a vital part of your ongoing social media KPI tracking.
Comparing Reach and Impressions Across Campaigns or Periods
To compare reach and impressions across different campaigns or time periods, use consistent metrics and reporting parameters. Use a spreadsheet or dedicated analytics tool to organize and analyze data. Tracking key metrics, such as engagement rate and click-through rates, along with reach and impressions, provides a comprehensive view of campaign performance. Comparing data across campaigns and periods enables you to identify trends and optimize your future efforts.
Reach and Impression Metrics Table
| Metric | Description | Significance ||———————|—————————————————————————————————————————————————————————|———————————————————————————————————————————————————————————–|| Reach | The number of unique users who saw your content at least once.
| Indicates the potential audience size exposed to your content.
|| Impressions | The total number of times your content was displayed.
| Measures the overall visibility of your content.
|| Engagement Rate | The percentage of users who interacted with your content (e.g., likes, comments, shares).
| Indicates how effectively your content resonates with your audience.
|| Click-Through Rate (CTR) | The percentage of users who clicked on a link in your content.
| Measures the effectiveness of your calls to action and the potential for conversions.
|| Organic Reach | Number of users who saw your content without any paid promotion.
| Reflects the natural interest and engagement generated by your content.
|| Paid Reach | Number of users who saw your content through paid advertising campaigns.
| Shows the impact of your paid advertising strategy.
|
Analyzing Website Traffic from Social Media
Social media isn’t just about likes and shares; it’s a powerful engine for driving traffic to your website. Understanding how social media campaigns impact website visits is crucial for optimizing your marketing efforts. This involves more than just observing the volume of clicks; it’s about analyzing the quality of those clicks and pinpointing which platforms and campaigns are most effective.
Tracking Website Traffic from Social Media Campaigns
To effectively measure the impact of social media on website traffic, you need robust tracking mechanisms. This involves implementing UTM parameters in your social media links. These parameters allow you to precisely identify which social media post or campaign drove a specific visitor to your website. This data is vital for understanding the ROI of your social media investments.
Without proper tracking, you’re flying blind, unable to discern which strategies are actually yielding results.
Tools for Measuring Social Media Traffic
Several tools can help you monitor website traffic originating from social media. Google Analytics is a cornerstone for this, providing comprehensive data on traffic sources, including social media platforms. Other analytics platforms, such as Hootsuite or Buffer, often integrate with Google Analytics, offering a streamlined approach to tracking and reporting.
Analyzing Platform Effectiveness
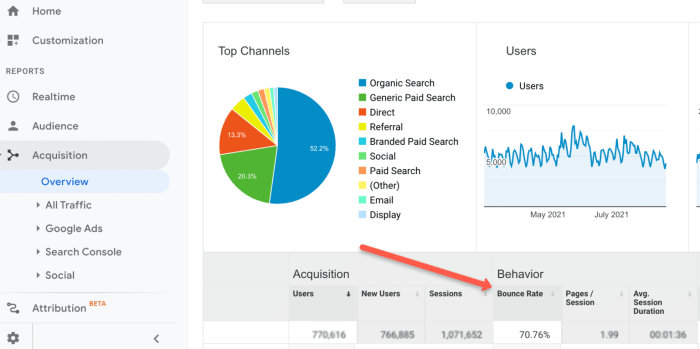
Determining which social media platforms are most effective in driving traffic requires careful analysis of the data collected. Look at the unique visitors from each platform, the bounce rate, and the average time spent on the website for each platform. A platform with a high bounce rate might indicate that your content isn’t relevant or engaging on that particular channel.
Comparing Traffic from Different Platforms
Comparing website traffic from different social media platforms involves creating custom reports in your analytics platform. This allows you to side-by-side compare metrics like unique visitors, page views, and conversion rates across platforms. A significant difference in engagement rates across platforms suggests you might need to adjust your content strategy for each one.
Website Traffic Metrics and Social Media Correlation
| Website Traffic Metric | Correlation with Social Media Activity | Example |
|---|---|---|
| Unique Visitors | Higher social media engagement often correlates with a higher number of unique visitors. | A successful social media campaign might drive 500 unique visitors to your site in a week. |
| Page Views | Social media posts that link to specific pages on your website will increase the page views for those pages. | A blog post shared on Twitter might generate 100 page views for that specific blog post. |
| Bounce Rate | High bounce rates from a particular social media platform might indicate that the content shared isn’t relevant to the audience. | If a post on Instagram links to a product page, but users quickly leave the page without further engagement, it suggests the content on the page may not match the audience’s expectations. |
| Average Session Duration | Engaging content shared on social media will likely lead to longer average session durations on the website. | A compelling infographic shared on LinkedIn might result in users spending an average of 5 minutes on your site. |
| Conversion Rate | Conversion rates, like purchases or sign-ups, can be influenced by effective social media campaigns driving targeted traffic to specific landing pages. | A well-targeted Facebook ad that directs users to a landing page for a discount might generate 20 conversions per week. |
Monitoring Brand Mentions and Sentiment
Staying on top of what people are saying about your brand on social media is crucial for reputation management and identifying emerging trends. Monitoring brand mentions, and more importantly, the sentiment behind those mentions, allows you to proactively address issues, capitalize on positive feedback, and adapt your strategies in real-time. This proactive approach ensures your brand remains relevant and resonates with your target audience.Understanding the sentiment surrounding your brand mentions is paramount to making informed decisions.
A thorough analysis reveals not just what people are saying, but alsohow* they’re feeling about your brand. This emotional context is vital for tailoring your marketing efforts and responding effectively to both positive and negative feedback. Knowing if the conversation is overwhelmingly positive or rife with negativity provides a clear picture of your brand’s health and allows for prompt intervention where necessary.
Monitoring Brand Mentions on Social Media Platforms
Social media platforms are constantly buzzing with conversations, many of which include mentions of your brand. To effectively track these mentions, use dedicated tools or set up alerts for specific s, hashtags, and handles related to your brand. This comprehensive approach allows for a real-time understanding of the conversations surrounding your brand and enables you to address issues swiftly.
Automated tools are vital for scaling this process as social media volume grows.
Analyzing Sentiment Surrounding Brand Mentions
Sentiment analysis tools are crucial for deciphering the emotional tone of brand mentions. These tools analyze text data, identifying positive, negative, or neutral sentiment. Positive mentions signal strong brand loyalty, while negative mentions highlight potential problems requiring attention. Neutral mentions provide insights into areas where your brand can engage further to spark greater interest. Sentiment analysis goes beyond just counting mentions; it’s about understanding the emotional context behind them.
Strategies for Identifying Key Influencers and Their Impact on Brand Sentiment
Identifying key influencers who are actively discussing your brand is essential. Tools can analyze their engagement levels, follower counts, and the sentiment of their posts to gauge their influence. Influencers with high engagement and a positive sentiment towards your brand can amplify your message and positively impact brand perception. Conversely, negative sentiment from influential voices can be a serious threat.
Examples of Using Social Listening Tools to Monitor Brand Mentions
Social listening tools provide a centralized dashboard for tracking mentions, sentiment, and key influencers. For example, tools like Brand24, Mention, and Sprout Social can be used to monitor various social media platforms for mentions of your brand or relevant s. These tools provide detailed reports and analytics, making it easy to understand the sentiment and identify trends in real-time.
By using filters and specific s, you can narrow down the data to focus on relevant conversations.
Categorization of Social Media Sentiment Analysis Tools
| Tool | Features | Pros | Cons |
|---|---|---|---|
| Brand24 | Comprehensive social listening, sentiment analysis, influencer identification | Wide range of features, detailed reports | Can be expensive for smaller businesses |
| Mention | Real-time monitoring, alert systems, competitor analysis | Excellent for staying updated, customizable alerts | Limited reporting depth compared to other tools |
| Sprout Social | Social media management, listening, and engagement tools | Integrated platform for comprehensive social management | May have a steeper learning curve for those new to the platform |
| Talkwalker | Advanced social listening, competitive analysis, brand monitoring | In-depth analytics, robust reporting | Usually a higher price point |
Conversion Tracking and ROI
Social media marketing is no longer just about building a brand presence. It’s about driving tangible results, and that’s where conversion tracking and ROI analysis become crucial. Understanding how social media campaigns translate into sales, leads, or other desired actions is essential for optimizing your strategies and demonstrating their value. This section delves into the practical aspects of measuring social media conversions and calculating the return on investment.Conversion tracking is the process of monitoring the actions users take after interacting with your social media content.
These actions, or conversions, can vary greatly, from filling out a contact form to making a purchase. By meticulously tracking these conversions, you gain valuable insights into campaign effectiveness and can fine-tune your strategies to maximize results.
Conversion Tracking Methods
Conversion tracking methods vary based on the specific actions you want to monitor. Effective tracking requires setting up clear goals and selecting the right tools. The key is to choose methods that accurately reflect the user journey and conversion paths. Common methods include using UTM parameters in social media links, employing tracking pixels, and integrating with your CRM or e-commerce platform.
Calculating ROI
Calculating the return on investment (ROI) of social media campaigns involves comparing the revenue generated from social media activity to the costs associated with those campaigns. The ROI formula, while simple, provides crucial insight into the profitability of your efforts.
ROI = (Net Profit / Cost of Investment) x 100%
Keeping tabs on your social media KPIs is crucial for gauging performance. But, understanding how Google AI Max explained in google ai max explained can unlock even deeper insights. Ultimately, this data-driven approach helps you fine-tune your social media strategy for maximum impact.
This calculation requires careful tracking of both revenue and costs. For example, if a campaign costs $1,000 and generates $3,000 in revenue, the ROI is 200%. Understanding your specific costs (e.g., ad spend, labor) is critical to accurate ROI calculations.
Linking Social Media to Sales
Linking social media activity to sales requires establishing clear connections between clicks on social media ads or posts and subsequent purchases. This can be achieved through various methods, such as unique tracking codes and detailed reporting features in social media platforms. Tools like Google Analytics and social media analytics platforms provide a framework for understanding the relationship between social media interactions and sales.
You should also consider the sales funnel.
Segmenting Social Media Data
Segmenting social media data allows for a more granular understanding of conversion patterns. For example, you can analyze conversions based on demographics, device type, or even specific campaign elements. Analyzing conversion rates across different audience segments enables you to optimize your campaigns and identify which groups respond best to your social media efforts. This could mean targeting specific interests, ages, or locations to improve conversion rates.
Keeping an eye on your social media KPIs is crucial for success, but remember to stay legally compliant when crafting marketing emails. For example, ensure you’re following all relevant regulations, like GDPR, CAN-SPAM, or other region-specific rules, when communicating with your audience. This includes being transparent about your data collection practices and giving clear unsubscribe options. Ultimately, a strong social media strategy relies on staying in line with the law when sending marketing emails, which in turn helps you avoid penalties and maintain a positive brand image, leading to better KPIs in the long run.
stay in line with the law when sending marketing emails Tracking those KPIs will show you how your email campaigns are performing, helping you refine your approach for optimal results.
Comparison of Conversion Tracking Methods
| Method | Accuracy | Ease of Implementation | Cost |
|---|---|---|---|
| UTM Parameters | High | Easy | Low |
| Tracking Pixels | High | Medium | Low to Medium |
| Conversion Tracking Pixels (Facebook/Instagram) | High | Medium | Low |
| Social Media Platform Analytics | Medium | Easy | Low |
This table provides a simplified overview of different conversion tracking methods. Accuracy varies based on the specifics of each method and implementation. For example, UTM parameters are highly accurate when properly implemented, but relying solely on platform analytics might provide a less detailed picture. Consider your specific needs and resources when choosing a method.
Social Media KPI Reporting
Social media is a powerful tool for businesses, but its effectiveness hinges on careful monitoring and analysis. Regular reporting on key performance indicators (KPIs) provides valuable insights into campaign performance, audience engagement, and overall return on investment. A well-structured reporting process ensures that you’re not just collecting data, but leveraging it to make data-driven decisions.Understanding your social media performance is crucial.
Regular reporting allows you to track progress, identify areas for improvement, and optimize strategies for maximum impact. This process goes beyond simple metrics; it’s about transforming raw data into actionable insights that fuel growth and enhance your social media strategy.
Reporting Structure for Social Media KPIs
A robust reporting structure streamlines the process, ensuring consistency and clarity. This includes defining specific reporting periods (weekly, monthly, quarterly), the key performance indicators (KPIs) to track, and a consistent format for presenting the data. This approach allows for easy comparison across periods and facilitates trend identification.
Presenting Social Media Data Clearly and Concisely
Presenting social media data in a clear and concise manner is vital for effective communication. Using charts and graphs, alongside tables, enhances understanding and highlights key trends. Choose visuals that clearly illustrate the data, avoiding clutter or overly complex designs. A simple, easy-to-understand format ensures that stakeholders can quickly grasp the key takeaways.
Creating Dashboards and Reports to Visualize Social Media Performance
Visual dashboards provide a comprehensive overview of social media performance. These dashboards can be customized to display specific metrics relevant to your business goals. For instance, a dashboard could highlight engagement rates, reach, website traffic, and conversion rates from social media. Tools like Google Data Studio, Tableau, or even spreadsheet software can be used to create these insightful visuals.
Key Performance Indicators and Metrics for Social Media Effectiveness
Various KPIs and metrics provide a multifaceted view of social media effectiveness. Some examples include:
- Engagement Rate: This measures audience interaction, including likes, comments, shares, and retweets. A high engagement rate indicates that your content resonates with your audience.
- Reach: The number of unique users who saw your content. High reach suggests a broad audience awareness of your brand.
- Impressions: The total number of times your content was displayed. Impressions indicate the potential visibility of your message.
- Website Traffic from Social Media: Tracking how many visitors arrive on your website from social media channels is essential. This indicates the effectiveness of your social media strategy in driving traffic to your website.
- Conversion Rate: The percentage of users who complete a desired action (e.g., making a purchase, signing up for a newsletter) after interacting with your social media content. High conversion rates demonstrate the effectiveness of your campaigns in achieving business objectives.
- Brand Mentions and Sentiment Analysis: Monitoring how often your brand is mentioned and the sentiment associated with those mentions provides insights into public perception. Positive sentiment demonstrates brand favorability.
Identifying Key Takeaways and Actionable Insights from Reports
Reviewing social media reports goes beyond simply observing numbers. Identify trends, patterns, and anomalies. Are engagement rates declining for specific content types? Is website traffic from a particular platform exceeding expectations? Understanding the reasons behind these patterns is critical for strategic adjustments.
For instance, if engagement is low for a particular post, consider adjusting the content’s tone, visuals, or targeting to improve resonance with the audience. This systematic analysis allows for continuous optimization of social media strategies.
Conclusive Thoughts

In conclusion, mastering social media KPI tracking empowers you to make data-driven decisions for optimizing your online presence. Understanding metrics like engagement, reach, and conversions provides a roadmap to success, allowing you to refine your strategies and maximize your return on investment. By analyzing website traffic and brand sentiment, you can fine-tune your approach for achieving your specific business objectives.
This comprehensive guide equips you with the knowledge and tools needed to navigate the complex world of social media analytics.


