
How to conduct market research is a crucial skill for any business looking to thrive in today’s competitive landscape. This guide delves into the intricacies of market research, from defining your objectives to interpreting findings. We’ll explore various research methods, from surveys and interviews to secondary data analysis, providing practical steps and actionable insights to help you make informed decisions.
This detailed overview will equip you with the knowledge and tools to effectively gather, analyze, and interpret market data, ultimately leading to a deeper understanding of your target audience and the market trends impacting your business.
Defining Market Research Objectives
Market research is the systematic gathering, analysis, and interpretation of data about a specific market, its consumers, and competitors. It’s a crucial tool for businesses to understand their customers, identify opportunities, and make informed decisions about product development, marketing strategies, and overall business direction. This understanding allows businesses to adapt to changing market dynamics and gain a competitive edge.
Its scope encompasses a wide range of activities, from identifying consumer preferences to evaluating the effectiveness of advertising campaigns.Defining the specific objectives of your market research is paramount. A clear understanding of what you hope to achieve guides the entire process, ensuring that the research aligns with your business goals and yields actionable insights. Without well-defined objectives, you risk collecting irrelevant data, wasting resources, and ultimately failing to gain the knowledge necessary to make informed decisions.
Precise objectives prevent wasted effort and ensure the research directly addresses the crucial business questions.
Types of Market Research
Market research can be broadly categorized into three main types: descriptive, causal, and exploratory. Each type serves a unique purpose and employs different methodologies. Understanding these distinctions is essential for choosing the right approach for your specific needs.
- Descriptive Research: This type of research focuses on describing the characteristics of a population or phenomenon. It aims to quantify and detail the current market situation, such as market size, customer demographics, and product usage patterns. Examples include surveys to measure customer satisfaction or analyzing sales data to understand product performance.
- Causal Research: This type of research investigates cause-and-effect relationships between variables. It aims to understand why certain events occur and how changes in one variable affect others. Experiments are often used to determine causality, such as testing the effectiveness of a new marketing campaign on sales figures.
- Exploratory Research: This type of research is used to explore a phenomenon with limited prior knowledge. It aims to gain a better understanding of the problem or opportunity and generate hypotheses for future research. This might involve conducting focus groups to gather preliminary feedback on a new product concept or reviewing industry reports to identify emerging trends.
Importance of Defining Research Objectives
Clearly defining your research objectives is crucial for a successful market research project. It guides every step of the process, ensuring that the research is relevant and provides the insights needed to inform business decisions. Without clear objectives, the research may not address the specific questions that need answering, resulting in wasted time and resources. A well-defined objective, for example, might be to determine the impact of a price change on sales volume.
Identifying Target Markets and Customer Segments
Identifying target markets and customer segments is a vital part of market research. This involves understanding the needs, wants, and characteristics of the individuals or groups who are most likely to buy your product or service. This involves analyzing factors like demographics, psychographics, geographic location, and purchasing behavior. Segmentation allows you to tailor your marketing efforts to specific customer groups, improving the effectiveness of your campaigns and boosting sales.
A well-defined target market, for example, might be young professionals in urban areas interested in eco-friendly products.
Different Types of Market Research and Their Applications
| Type of Market Research | Description | Applications |
|---|---|---|
| Descriptive Research | Describes characteristics of a market or population | Measuring market size, customer demographics, brand awareness, product usage, and customer satisfaction. |
| Causal Research | Investigates cause-and-effect relationships | Testing the effectiveness of marketing campaigns, determining the impact of price changes on sales, evaluating the impact of new product features on customer satisfaction. |
| Exploratory Research | Explores a phenomenon with limited prior knowledge | Identifying emerging market trends, generating hypotheses, understanding customer needs for a new product or service, uncovering reasons for product failures. |
Primary Research Methods
Primary research methods are crucial for gathering firsthand data directly from the target market. This data provides a deeper understanding of consumer preferences, behaviors, and needs, enabling businesses to tailor their products and services more effectively. Understanding these methods empowers informed decision-making and a stronger connection with the target audience.Primary research methods offer a wealth of information, allowing for a highly specific and tailored approach to gathering insights.
Understanding your target market is key to successful market research. Tools like search rank results and rank brain can reveal valuable insights into what people are searching for online, helping you tailor your research strategies. For example, analyzing search trends and competitor rankings via search rank results and rank brain can pinpoint unmet needs and highlight potential opportunities.
This data can then be used to refine your research methods, ensuring you’re focusing on the right questions and gathering the most relevant information.
By directly engaging with consumers, researchers can obtain accurate and up-to-date information on market trends, customer opinions, and competitive landscapes. This allows businesses to develop strategies aligned with consumer expectations.
Survey Methods
Surveys are a common primary research method, involving structured questionnaires distributed to a sample of individuals. They provide a comprehensive way to collect data on various aspects of the target market, such as demographics, purchasing habits, and brand perceptions. The ability to collect data from a large sample size makes surveys cost-effective and efficient for broad market assessments.
- Surveys can be conducted online, via phone, or in person, offering flexibility in reaching the target audience. This versatility allows researchers to select the most appropriate method for their specific needs and resources.
- Surveys are effective for gathering quantitative data, enabling statistical analysis to identify trends and patterns within the responses.
- However, survey responses can be influenced by biases in the questionnaire design or participant selection. Carefully crafted questions and a representative sample are essential to minimize these biases.
Interviews
In-depth interviews are another valuable primary research technique, involving one-on-one conversations with individuals to gain qualitative insights. This method offers a unique opportunity to explore complex issues and delve deeper into consumer motivations and perspectives. Interviews often provide rich data that is not readily accessible through other methods.
- Interviews provide a flexible platform for exploring sensitive topics or nuanced opinions.
- The detailed nature of interviews can reveal valuable insights into consumer behavior and preferences.
- However, interviews can be time-consuming and costly, especially when conducted with a large sample size. They also require skilled interviewers to elicit meaningful responses and ensure accurate recording.
Focus Groups
Focus groups involve bringing together a small group of individuals to discuss a specific topic or product. These discussions generate rich insights into consumer attitudes, perceptions, and reactions. Focus groups are valuable for understanding group dynamics and exploring shared perspectives.
- Focus groups are helpful in generating ideas and uncovering unanticipated insights, facilitating the development of new products or services.
- The interactive nature of focus groups allows for real-time feedback and the identification of potential issues.
- However, the results can be susceptible to the influence of dominant personalities or groupthink within the focus group, potentially skewing the overall findings.
Experiments, How to conduct market research
Experiments are used to test hypotheses and determine cause-and-effect relationships within a controlled environment. This approach is particularly valuable in evaluating the impact of different marketing strategies or product features on consumer behavior. Experiments can be used to validate assumptions and measure the effectiveness of various approaches.
- Experiments offer a structured and controlled environment to assess the impact of variables on consumer responses.
- The controlled nature of experiments minimizes external factors that might affect the results.
- Experiments can be complex to design and execute, requiring careful planning and consideration of potential confounding variables.
Questionnaire Design for Surveys
A well-designed questionnaire is crucial for effective survey results. A structured approach to question design ensures accurate and reliable data collection. Consider the following steps when creating a survey questionnaire:
- Define the research objectives: Clearly articulate the information needed to address the research questions.
- Develop a questionnaire structure: Organize questions logically to guide the respondent through the survey.
- Choose appropriate question types: Select question formats (e.g., multiple choice, open-ended) that suit the information needed.
- Ensure question clarity: Use concise and unambiguous language to avoid misinterpretations.
- Pilot test the questionnaire: Gather feedback on clarity and ease of completion before full-scale distribution.
Comparison of Primary Research Methods
| Method | Suitability for Objectives |
|---|---|
| Surveys | Quantifying attitudes, behaviors, and demographics |
| Interviews | Understanding motivations, opinions, and detailed perspectives |
| Focus Groups | Generating ideas, exploring group dynamics, and understanding reactions |
| Experiments | Testing cause-and-effect relationships and evaluating strategies |
Secondary Research Methods
Unlocking valuable insights without conducting extensive surveys or interviews? Secondary research is the key. It leverages existing data to understand market trends, competitor strategies, and consumer behavior, saving time and resources compared to primary research. This approach is crucial for gaining a broad overview before investing in more in-depth studies.
Types of Secondary Research
Secondary research relies on existing data, offering a wealth of information without the need for fieldwork. This approach encompasses various forms, each with unique strengths and limitations. Understanding these different types allows researchers to choose the most appropriate method for their specific needs.
- Market Reports: These comprehensive reports provide detailed analyses of specific markets, industries, or segments. They often include statistical data, forecasts, and expert opinions, offering valuable context for understanding market trends. Examples include reports from market research firms like Nielsen or Statista, offering insights into consumer preferences and purchasing patterns.
- Industry Data: Government publications, trade associations, and industry-specific databases offer crucial data on market size, growth rates, and competitive landscapes. These sources provide an overview of the overall industry environment, revealing significant trends and opportunities.
- Competitor Analysis: Examining competitor strategies, product offerings, and market share can offer a deep understanding of the competitive landscape. Analyzing publicly available information, such as company websites, annual reports, and press releases, can illuminate key competitor activities and strategies.
Evaluating Data Credibility and Reliability
Trusting the information you gather is paramount. Assessing the credibility and reliability of secondary data sources is essential to ensure accurate insights. This involves critically evaluating the source’s reputation, methodology, and potential biases. Poor quality data can lead to flawed conclusions and misguided strategic decisions.
- Source Reputation: A reputable source with a proven track record of accurate and unbiased reporting is crucial. Look for established market research firms, government agencies, or industry associations with a strong history of delivering reliable data.
- Methodology: Understanding the methodology behind data collection and analysis is essential. Was the data gathered through reliable methods? Were there any limitations in the methodology that might have impacted the results?
- Potential Biases: Consider potential biases that might influence the data. For instance, a company’s own marketing materials might present a biased view of their products or services. Be aware of the source’s motivations and potential conflicts of interest.
Locating and Accessing Secondary Data
Accessing relevant secondary data sources requires effective research strategies. Knowing where to look and how to filter information is crucial for finding the right data.
- Databases: Numerous databases offer access to market research reports, industry data, and financial information. Databases like IBISWorld, Statista, and Bloomberg provide comprehensive information for various industries.
- Libraries: Academic and public libraries often subscribe to valuable databases and journals that contain industry research and market reports. Don’t overlook the wealth of information available through library resources.
- Online Search Engines: Utilize search engines like Google Scholar, specialized search engines, or industry-specific websites to find relevant reports, articles, and publications.
Utilizing Secondary Research for Insights
Secondary research can uncover valuable insights into market trends and competitor activities. Analyzing this data can guide strategic decision-making.
- Market Trends: Identify emerging trends and patterns in consumer behavior, technological advancements, or economic shifts. Analyzing market reports and industry data provides valuable context to understand the market’s direction.
- Competitor Activities: Monitor competitor strategies, product launches, and marketing campaigns to anticipate their next moves. This proactive approach allows businesses to stay ahead of the competition and adapt to changing market conditions.
Key Sources of Secondary Market Research Data
| Source Category | Examples |
|---|---|
| Market Research Firms | Nielsen, Statista, Forrester Research |
| Government Agencies | Census Bureau, Bureau of Labor Statistics |
| Industry Associations | Retail Industry Leaders Association, Association of Marketing Professionals |
| Academic Journals & Publications | Harvard Business Review, Journal of Marketing |
| Company Websites & Reports | Annual reports, investor presentations |
Data Collection and Analysis
Collecting and analyzing data is the crucial step in market research. It’s where the insights gleaned from your research objectives transform into actionable strategies. This phase requires meticulous attention to detail, from the initial data collection methods to the final presentation of findings. Choosing appropriate methods, ensuring data quality, and employing effective analytical techniques are key to deriving valuable conclusions.
Data Collection Methods
Data collection methods can be broadly categorized as online and offline. Online methods, like surveys and online focus groups, offer cost-effectiveness and broader reach, allowing for quicker data collection. Offline methods, including in-depth interviews and observations, provide richer qualitative data but often involve higher costs and longer timelines. The choice of method depends on the research objectives, budget, and the type of data needed.
- Online Data Collection: Utilizing online platforms for surveys, questionnaires, and polls allows for rapid data gathering from a geographically dispersed sample. Tools like SurveyMonkey and Google Forms simplify the process. This method is particularly useful for gathering quantitative data and testing hypotheses.
- Offline Data Collection: In-depth interviews, focus groups, and observations provide qualitative data that delves deeper into consumer motivations and behaviors. These methods are often more expensive and time-consuming, but they can yield richer insights for understanding nuanced customer preferences.
Data Validation and Quality Assurance
Data quality is paramount. Validated data ensures the accuracy and reliability of the findings. Data validation involves checking for inconsistencies, errors, and biases in the collected data. This process can include verifying the respondent’s identity, cross-checking responses, and confirming the accuracy of the data entry. Data quality can be significantly affected by factors like incomplete responses, inaccurate data entry, or sampling biases.
- Data Validation Techniques: Employing data cleaning techniques such as identifying and correcting inconsistencies, handling missing values, and outlier detection ensures the reliability of your analysis. This involves careful scrutiny of the collected data to maintain accuracy.
- Maintaining Data Quality: Strict adherence to a standardized data collection protocol, clear instructions for respondents, and diligent quality control procedures are essential to maintain data integrity. This minimizes errors and enhances the overall quality of the research.
Data Analysis Methods
Effective data analysis transforms raw data into meaningful insights. Methods such as statistical analysis, data visualization, and pattern recognition provide structure and interpretation to the collected information. Statistical analysis helps identify trends and patterns, while data visualization makes complex data more accessible and understandable. Pattern recognition, through data mining techniques, uncovers hidden relationships and insights that might otherwise go unnoticed.
Understanding your target audience is key to successful market research. For instance, analyzing Black Friday ad campaigns, like those found at black friday ad campaigns , reveals crucial consumer trends and preferences. This data helps tailor your marketing strategies for maximum impact, leading to a more comprehensive and effective market research process overall.
- Statistical Analysis: Techniques like regression analysis, t-tests, and chi-square tests help determine the significance of relationships between variables. For example, a correlation analysis can uncover whether a particular marketing campaign correlates with increased sales.
- Data Visualization: Visual representations of data, such as charts, graphs, and dashboards, simplify the understanding of complex information. A well-designed bar chart, for instance, can clearly illustrate sales figures across different regions.
- Pattern Recognition: Advanced data mining techniques uncover hidden relationships and trends in large datasets. This can involve clustering techniques or machine learning algorithms to identify segments of consumers with similar behaviors.
Using Data Analysis Tools
Various software tools aid in data analysis, facilitating the extraction of actionable insights. Spreadsheets like Excel, specialized statistical packages like SPSS or R, and data visualization tools like Tableau can help transform raw data into compelling visualizations and insights.
- Choosing the Right Tools: Selecting the appropriate software depends on the type of data, the analysis required, and the user’s technical expertise. Excel is often suitable for basic analysis, while more advanced tools like R or Python are better suited for complex statistical models.
- Extracting Actionable Insights: Transforming the analyzed data into actionable insights requires identifying key trends, patterns, and relationships. This step leads to informed decisions about product development, marketing strategies, and pricing.
Data Analysis Techniques and Applications
| Technique | Application |
|---|---|
| Regression Analysis | Predicting sales based on marketing spend |
| Clustering | Identifying customer segments with similar purchasing behaviors |
| Sentiment Analysis | Determining public opinion on a new product launch |
| A/B Testing | Comparing the effectiveness of different marketing campaigns |
| Time Series Analysis | Forecasting sales trends over time |
Reporting and Interpretation of Findings: How To Conduct Market Research
Bringing your market research to life requires more than just gathering data. A crucial step is effectively communicating your findings to stakeholders, translating complex information into actionable insights. This phase ensures your research delivers tangible value, leading to informed decisions and ultimately, business success.Clear and concise presentation of findings is paramount. Vague or poorly presented data loses its impact, making it difficult for stakeholders to understand the implications and act upon them.
This section details strategies for presenting and interpreting your market research, focusing on clarity, accessibility, and actionable conclusions.
Presenting Research Findings
Effective communication is key to translating your research into valuable insights for stakeholders. A well-structured report, engaging presentation, or insightful dashboard can transform raw data into actionable strategies. Different formats cater to various audiences and purposes.
- Reports: A comprehensive report provides a detailed overview of the research process, methodology, findings, and conclusions. It serves as a permanent record and detailed reference for stakeholders. Reports are particularly useful for in-depth analysis and provide a thorough understanding of the market landscape.
- Presentations: Presentations condense key findings into a digestible format for audiences with limited time. Visual aids, such as charts and graphs, are essential to make the data engaging and memorable. They are excellent for conveying a summary of the research to executive teams or client presentations.
- Dashboards: Dashboards offer a real-time overview of key metrics and trends. They are particularly useful for monitoring performance, tracking progress, and identifying potential issues. These interactive tools enable stakeholders to monitor progress and make data-driven decisions on an ongoing basis.
Interpreting Findings and Drawing Conclusions
Interpreting your findings requires careful consideration of the context and the broader market landscape. It’s not enough to simply present the data; you need to connect the dots and identify meaningful trends. This involves recognizing patterns, identifying correlations, and drawing inferences about the market’s behavior.

- Identifying Trends: Look for recurring patterns or shifts in the data. For example, a consistent decline in sales figures in a particular region could signal a need for a localized marketing campaign. Identify these recurring patterns to anticipate future market behavior.
- Correlating Variables: Determine the relationships between different variables. If a rise in advertising expenditure is consistently followed by a sales increase, a strong correlation exists. Understanding these correlations helps to identify effective marketing strategies.
- Drawing Actionable Conclusions: Based on the trends and correlations, draw actionable conclusions. What are the implications of your findings for the business? What specific actions can be taken to address the identified challenges or capitalize on opportunities?
Accessibility and Stakeholder Understanding
Tailoring your presentation to the specific needs of different stakeholders is crucial. Executive summaries should be concise and highlight key takeaways, while detailed reports cater to a deeper understanding. Visual aids and clear explanations of technical terms are essential for all stakeholders to comprehend the data.
Understanding your target audience is key to effective market research. Knowing what they need and want is crucial for any business. A great way to start is by identifying your ideal customer and their pain points, and this directly relates to finding a simple yet effective way to convert blog visitors into customers, which can be learned from this helpful resource: a simple yet effective way to convert blog visitors into customers.
Then, you can tailor your products and services to meet those needs, ultimately leading to more successful market research strategies.
- Executive Summaries: Condense complex findings into brief, easily digestible summaries highlighting key takeaways and recommendations. These are designed for senior management to quickly grasp the implications of the research.
- Visualizations: Use charts, graphs, and other visual aids to make the data more accessible and understandable. Visualizations should be clear, concise, and effectively communicate the message.
- Clear Language: Avoid jargon and technical terms where possible. Use plain language to ensure all stakeholders can grasp the essence of the research.
Visual Presentation Methods
Visual representations of data significantly enhance comprehension. They provide a clear picture of trends and patterns, making it easier for stakeholders to grasp complex information. Different presentation methods cater to various needs and preferences.
| Presentation Method | Description | Example |
|---|---|---|
| Bar Charts | Compare quantities across different categories. | Sales figures by product line |
| Line Charts | Track changes in data over time. | Website traffic growth over quarters |
| Pie Charts | Show the proportion of different components within a whole. | Market share of competitors |
| Scatter Plots | Illustrate the relationship between two variables. | Correlation between advertising spend and sales |
Ethical Considerations in Market Research
Market research, while crucial for informed business decisions, must be conducted ethically. Ignoring ethical considerations can damage a company’s reputation, erode public trust, and even lead to legal repercussions. A strong ethical framework ensures the integrity of the research process and the well-being of participants. This section delves into the importance of ethical principles in market research, emphasizing the need for transparency, fairness, and respect for individuals.
Importance of Ethical Considerations
Ethical considerations are paramount in market research to protect the rights and interests of participants, maintain public trust, and ensure the validity and reliability of research findings. A failure to adhere to ethical standards can result in biased data, compromised research integrity, and reputational damage for the company conducting the research. Furthermore, ethical conduct fosters a positive image and builds trust among stakeholders, ultimately benefiting the research process and the company’s overall success.
Principles of Informed Consent
Informed consent is a fundamental ethical principle in market research. Participants must be fully aware of the purpose, procedures, potential risks, and benefits of the research before agreeing to participate. This means providing clear and concise information about the study’s objectives, how data will be collected and used, and the participant’s rights. A well-designed informed consent process ensures voluntary participation and protects the autonomy of individuals involved in the research.
Examples of explicit information include potential risks, potential benefits, the time commitment required, and the participant’s right to withdraw at any time without penalty.
Data Privacy and Confidentiality
Protecting the privacy and confidentiality of participants’ data is essential. Researchers must employ appropriate data security measures to prevent unauthorized access or disclosure of sensitive information. Data anonymization and encryption techniques are crucial. The specific methods for maintaining confidentiality depend on the type of data collected and the nature of the research. For example, using unique identifiers instead of names, storing data securely, and adhering to relevant data protection regulations are critical.
Potential Biases and Mitigation Strategies
Market research is susceptible to various biases, which can significantly impact the accuracy and reliability of findings. Researchers must be aware of potential biases, including selection bias, sampling bias, and response bias, and implement strategies to mitigate them. Examples of selection bias include choosing a sample that does not represent the target population, while response bias arises when participants answer questions in a way that may not accurately reflect their true opinions or behaviors.
Addressing these biases involves careful sample selection, appropriate survey design, and data validation procedures. Researchers should employ diverse and representative samples and use multiple data collection methods to enhance objectivity.
Maintaining Objectivity and Avoiding Manipulation
Maintaining objectivity and avoiding manipulation throughout the research process is critical. Researchers should strive to avoid personal biases or preconceived notions that could influence the data collection, analysis, or interpretation stages. Using standardized procedures and instruments, employing blind data analysis techniques, and seeking feedback from peers are all strategies for maintaining objectivity. Furthermore, researchers must ensure that the research design and methodology are not influenced by external pressures or incentives.
Ethical Guidelines for Conducting Market Research
- Obtain informed consent from participants: Ensure participants understand the study’s purpose, procedures, potential risks, and benefits before agreeing to participate. They should be free to withdraw at any time without penalty.
- Maintain data privacy and confidentiality: Employ appropriate data security measures to protect sensitive information. Anonymize or de-identify data wherever possible.
- Avoid bias in data collection and analysis: Use appropriate sampling techniques and data collection methods to minimize bias. Employ blind data analysis to enhance objectivity.
- Maintain objectivity and transparency: Strive to avoid personal biases or preconceived notions. Document the research process meticulously and transparently.
- Adhere to relevant regulations and guidelines: Comply with data protection laws and ethical guidelines specific to the research context.
- Seek external review and feedback: Obtain feedback from colleagues or ethics committees to ensure the study’s integrity.
Tools and Technologies for Market Research

Market research is no longer a purely manual process. A plethora of software and tools are now available to streamline data collection, analysis, and interpretation. These technologies empower researchers to gather insights more efficiently and effectively, leading to more informed decisions and ultimately, better business outcomes. The right tools can transform raw data into actionable strategies.Using the right technology is crucial in today’s fast-paced business environment.
These tools enable researchers to manage large datasets, perform complex analyses, and present findings in a visually compelling manner, ultimately improving the speed and quality of the research process. Proper selection and implementation of these tools are vital for success.
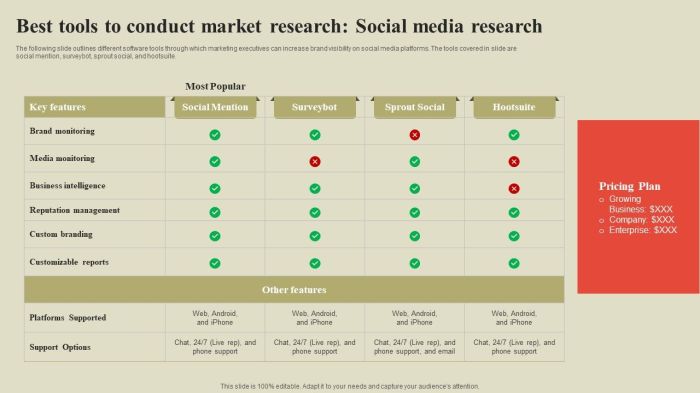
Survey Platforms
Survey platforms are essential for collecting primary data from target audiences. They provide a user-friendly interface for creating and distributing surveys, as well as collecting and managing responses. These platforms typically offer various question types, allowing for diverse data collection. They also offer robust analytics to understand trends and patterns in the responses.
- SurveyMonkey: A widely used platform known for its ease of use and comprehensive features. It offers various question types, including multiple choice, rating scales, and open-ended questions. SurveyMonkey’s reporting features allow for detailed analysis and visualization of the collected data.
- Qualtrics: A powerful platform known for its advanced features and capabilities, often preferred by large organizations and businesses conducting complex research. Qualtrics provides a wide array of tools for designing and analyzing surveys, offering detailed insights through comprehensive dashboards and reports.
- Typeform: Known for its visually appealing and user-friendly interface. Typeform excels in creating aesthetically pleasing and engaging surveys, helping to improve response rates by presenting a polished and modern look. It focuses on user experience above all else.
Data Analysis Software
Data analysis software is critical for transforming raw data into meaningful insights. These programs allow for the manipulation, cleaning, and analysis of large datasets. Advanced statistical techniques and visualization tools are often included.
- SPSS (Statistical Package for the Social Sciences): A widely used statistical software package offering a comprehensive suite of tools for statistical analysis, hypothesis testing, and data visualization. SPSS is particularly strong in handling quantitative data and complex statistical models.
- R: A powerful and versatile programming language and environment for statistical computing and graphics. R’s flexibility allows users to perform custom analyses and create highly tailored visualizations. Its extensive community support provides ample resources and tutorials for advanced analysis.
- Tableau: A data visualization tool focused on creating interactive dashboards and reports. Tableau excels in presenting complex data in an easily digestible and visually appealing format. It allows users to create custom dashboards and explore data through interactive visualizations.
Market Research Databases
Market research databases provide access to a wealth of secondary data. These databases contain information on various market segments, consumer trends, and competitive landscapes. They allow researchers to gain insights without conducting primary research.
- IBISWorld: Provides detailed industry analysis, market size estimates, and competitive landscape data. It helps researchers understand market trends and the competitive landscape for various industries.
- Statista: Offers a vast collection of statistics and market data on various topics. It’s valuable for researchers looking to validate their assumptions and gain insights from existing data.
- Mintel: Offers in-depth reports and analysis on consumer trends, market insights, and competitive intelligence. It provides valuable information about consumer behavior and purchasing patterns.
Comparison Table
| Tool | Primary Function | Strengths | Weaknesses | Suitability |
|---|---|---|---|---|
| SurveyMonkey | Creating and distributing surveys | Ease of use, comprehensive features | Limited advanced analysis | Small-scale research projects, quick data collection |
| Qualtrics | Creating and analyzing surveys | Advanced analytics, robust reporting | Steeper learning curve | Large-scale research projects, detailed insights |
| SPSS | Statistical analysis | Extensive statistical functions | Steeper learning curve | Quantitative research, complex analyses |
| R | Statistical computing and graphics | Highly flexible, customizable | Requires programming knowledge | Advanced statistical modeling, custom analyses |
| Tableau | Data visualization | Interactive dashboards, visual insights | Limited data analysis | Presenting research findings, identifying trends |
Epilogue
In conclusion, conducting market research is a multifaceted process requiring careful planning, execution, and interpretation. By following the steps Artikeld in this guide, you’ll be well-equipped to understand your target market, identify opportunities, and make data-driven decisions. Remember, the key to successful market research lies in its ability to provide actionable insights, leading to strategic business growth.


