
Connect Google Search Console analytics to unlock a treasure trove of insights into your website’s performance. This comprehensive guide delves into the process of integrating Search Console data with Google Analytics, empowering you to understand your search traffic, optimize content, and ultimately boost your website’s visibility and rankings.
From understanding basic data integration methods to advanced reporting techniques, we’ll explore how to leverage the combined power of Search Console and Analytics. We’ll cover everything from troubleshooting connection issues to optimizing your website content based on the invaluable data you’ll uncover.
Understanding Search Console Data Integration
Integrating Google Search Console data with other analytics platforms unlocks a deeper understanding of your website’s performance. This allows you to analyze search traffic, identify areas for improvement, and ultimately boost your organic visibility. By connecting Search Console with tools like Google Analytics, you gain a comprehensive view of your website’s performance from both a search perspective and a broader user perspective.
Methods for Importing Search Console Data
Data from Google Search Console can be imported into other platforms, most notably Google Analytics. This integration provides a unified view of your website’s performance. Different methods are available depending on your specific needs and the level of integration desired. One common method is through the use of API integrations, which allow for automated data transfer. Manual importing is also a viable option, though it might not be as efficient for larger datasets.
Connecting Search Console and Google Analytics Accounts
Connecting your Search Console and Google Analytics accounts is a straightforward process. The integration process is primarily managed within the Google Analytics platform. This process ensures that data from Search Console flows seamlessly into your existing Google Analytics account, enabling comprehensive analysis. This allows you to track key metrics like organic search traffic, click-through rates, and more.
Setting Up the Connection
The setup process involves a few crucial steps. First, ensure that both accounts are linked to the same Google account. Then, within your Google Analytics account, navigate to the “Acquisition” section. Find the “Search Console” option and click on it. Follow the on-screen prompts to authorize the connection.
The setup is completed once you’ve successfully authorized the connection.
Data Points Available for Integration
The following table illustrates the diverse data points available in Search Console that can be integrated with Google Analytics.
| Data Point | Description | Relevance to Analytics |
|---|---|---|
| Impressions | The number of times your website’s result page appeared in search results. | Shows visibility and potential reach. |
| Clicks | The number of times users clicked on your website’s result from a search. | Directly reflects user engagement with search results. |
| CTR (Click-Through Rate) | The percentage of users who clicked on your website’s result after seeing it in search results. | Indicates how attractive your search result appears to users. |
| Average Position | The average position of your website’s result page in search results. | Highlights ranking performance and opportunities for improvement. |
| Queries | The specific search terms users entered to find your website. | Provides insight into the s driving traffic. |
| Search Appearance | Details of how your website is displayed in search results (e.g., rich snippets, structured data). | Helps assess the effectiveness of your search presence and potential for rich results. |
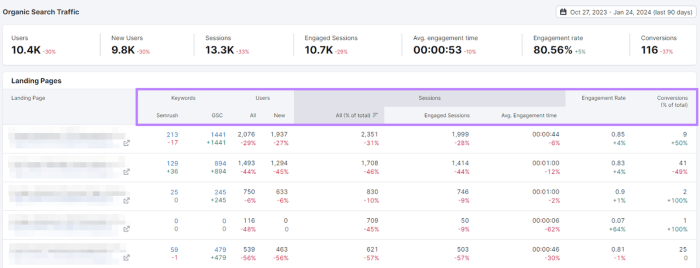
Analyzing Search Performance Metrics
Connecting Google Search Console and Analytics unlocks a treasure trove of data for understanding how users find your website. This combined view goes beyond simple website traffic to reveal the precise search queries driving visits, allowing you to tailor content and optimize for maximum impact. By analyzing search performance metrics, you can gain valuable insights into user behavior and refine your website strategy for better results.This analysis goes beyond basic website traffic data, delving into the specific search terms and phrases that bring users to your site.
This deeper understanding allows for a more targeted and effective approach to content optimization, leading to improved user engagement and higher search rankings.
Key Performance Indicators (KPIs) for Search Performance
Understanding the crucial metrics from Search Console and Analytics is vital. These KPIs, like impressions, clicks, and click-through rates (CTR), offer a comprehensive picture of your website’s search visibility and effectiveness. Tracking these metrics allows you to measure the impact of your optimization efforts.
- Impressions: The number of times your website’s result appeared in search results. High impressions indicate strong visibility but don’t necessarily equate to clicks. Tracking impressions helps understand how often your site is shown to potential users.
- Clicks: The number of times users clicked on your website’s result from a search engine result page (SERP). Clicks are a direct measure of user interest in your content.
- Click-Through Rate (CTR): The percentage of users who click on your website’s result from a search engine result page. A high CTR suggests that your site’s title and description effectively attract users. A lower CTR might indicate a need for more compelling meta descriptions.
- Average Position: The average ranking of your website for specific s in search results. Tracking this metric helps identify which s need more optimization effort.
Identifying and Interpreting Search Trends
Analyzing search trends from the integrated data helps identify seasonal patterns, popular topics, and shifts in user interest. These insights are invaluable for content planning and strategic adjustments.
- Seasonal Trends: Notice if certain s or search queries spike during specific times of the year. Understanding these patterns allows you to create relevant content in advance, potentially maximizing traffic.
- Topic Shifts: Identify emerging trends and popular topics by analyzing the frequency of search queries. This allows you to anticipate changes in user interests and adapt your content accordingly.
- Search Query Patterns: Look for recurring themes or patterns in the queries that lead users to your site. These patterns can highlight user needs and areas where your content might be missing the mark.
Comparing Data Integration Methods
Various methods exist for integrating Search Console and Analytics data. Direct import, custom reports, and third-party tools offer varying degrees of complexity and functionality. Understanding the strengths and weaknesses of each method is essential.
- Direct Import: This method is straightforward, often involving a simple connection. However, it might not offer the level of customization that some users require.
- Custom Reports: These allow you to combine data in ways not offered directly. They can be powerful for advanced analysis but may involve more technical expertise to set up.
- Third-Party Tools: These tools can automate data collection and analysis, providing comprehensive dashboards and insights. However, they often come with subscription costs.
Patterns in Search Query Data and Website Traffic
Correlating search query data with website traffic provides a clearer picture of what content resonates with users. Tracking this relationship allows you to identify the most effective search terms and optimize content accordingly.
- High-Volume s: Analyze the search queries that generate significant website traffic. Focus on optimizing content for these s to improve visibility and user engagement.
- Low-Volume s: While potentially less significant, low-volume s can still drive qualified traffic. Explore opportunities to improve content for these terms, potentially attracting a specific niche audience.
- Traffic Sources: Examine which search queries are directing the most traffic to different pages on your website. This insight can identify content areas that are performing well and where improvements are needed.
Optimizing Website Content
Combining Search Console and Analytics data allows you to optimize content for better search performance. A deep understanding of search queries allows you to create content that precisely meets user needs.
- Optimization: Incorporate relevant s naturally into your website content, titles, and meta descriptions to improve visibility.
- Content Strategy: Develop content strategies that address the needs and interests reflected in the search queries and website traffic.
- User Experience (UX): Ensure your website provides a seamless and user-friendly experience, aligning with user expectations based on search queries.
Understanding User Behavior and Improving Website Performance
Search Console and Analytics data provide insights into how users interact with your website. This knowledge allows you to identify areas for improvement in the user journey and enhance overall performance.
- Bounce Rate: Analyze the bounce rate for different pages and search queries to identify potential issues in content relevance or user experience.
- Session Duration: Evaluate the average session duration for different pages and search queries to understand the effectiveness of your content.
- User Engagement: Track user engagement metrics like page views and scrolls to understand which parts of your content are most engaging.
Search Performance Metrics Table
| Metric | Source | Implications |
|---|---|---|
| Impressions | Search Console | Website visibility in search results |
| Clicks | Search Console | User interest in website content |
| CTR | Search Console | Effectiveness of title and description |
| Average Position | Search Console | ranking performance |
| Bounce Rate | Analytics | Content relevance and user experience |
| Session Duration | Analytics | Content engagement and user interest |
Identifying Website Traffic Sources
Unveiling the origins of your website traffic is crucial for understanding user behavior and optimizing your online presence. Google Search Console, when integrated with analytics platforms, provides a wealth of information about how users find your site. This allows for targeted improvements to attract the right audience and enhance overall performance. This exploration delves into identifying traffic sources, pinpointing specific search queries, differentiating organic and paid traffic, and analyzing user behavior patterns.
Traffic Source Identification Through Integrated Analytics
Understanding where your website traffic originates is essential for strategic decision-making. Integrating Google Search Console data with your analytics platform provides a comprehensive view of user acquisition. This combination allows for a deep dive into the specific search queries, geographic locations, and devices driving traffic to your site, offering valuable insights into your target audience’s needs and preferences.
This combined data streamlines the process of understanding the full user journey and empowers informed decisions about content strategy, optimization, and overall website improvement.
Pinpointing Specific Search Queries Driving Traffic
Search Console’s performance reports meticulously detail the search queries that lead users to your website. Analyzing these queries provides valuable insights into what users are searching for, and how your content addresses their needs. Understanding the exact search terms employed by users is key to refining your content strategy and improving your website’s visibility in search results. This detailed data allows for more targeted optimization efforts and a better understanding of user intent.
Distinguishing Organic and Paid Traffic
Accurate traffic analysis hinges on differentiating between organic (natural search results) and paid (advertised) traffic sources. Search Console primarily focuses on organic traffic, revealing valuable insights into the effectiveness of your strategies. Separate analytics platforms are typically used to monitor paid traffic, which allows for a holistic view of user acquisition. This differentiation is critical for evaluating the impact of various marketing channels and allocating resources efficiently.
Example of a Website’s Search Query Performance Report
A hypothetical search query performance report for “best hiking trails near me” shows the following:
- The query “best hiking trails near me” generated 1,500 visits to the website.
- The average click-through rate (CTR) for this query was 2.5%.
- The average position of the website for this query was 5.
- The report further breaks down the data by geographic location, revealing that users in California and Colorado were most interested in this topic.
This example highlights the granular detail available within Search Console reports, allowing for a comprehensive understanding of user search behavior.
Analyzing User Behavior from Search Console Data
Search Console data provides insights into user behavior, including location, device, and search queries. This detailed data allows for a deeper understanding of user intent and preferences. For example, the data may reveal a significant portion of users accessing your website from mobile devices. Understanding the devices and locations from which users access your website allows for strategic content optimization and website design modifications.
Analysis of search queries and their associated landing pages reveals the most effective content strategies.
Top Search Queries Driving Traffic to a Sample Website
| Search Query | Visits | Click-Through Rate (CTR) | Average Position |
|---|---|---|---|
| best hiking trails near me | 1,500 | 2.5% | 5 |
| nearby nature reserves | 800 | 1.8% | 7 |
| easy day hikes | 650 | 2.0% | 4 |
| national park trails | 500 | 1.5% | 6 |
This table showcases a sample of the top search queries driving traffic to a fictional website. The data, derived from Search Console, provides a clear picture of user interests and allows for focused optimization efforts.
Troubleshooting Connection Issues

Connecting Google Search Console and Google Analytics is crucial for a comprehensive understanding of website performance. However, issues can arise during the setup and data synchronization process. This section delves into common problems, troubleshooting methods, and resolving discrepancies to ensure accurate data flow between the two platforms.Data discrepancies between Search Console and Analytics can stem from various factors, impacting the insights you gain.
Proper troubleshooting is essential to pinpoint the root cause and restore accurate data flow. Understanding these issues and implementing the suggested solutions will lead to a more reliable and effective analysis of your website’s performance.
Common Connection Problems
A smooth connection between Search Console and Analytics is essential for a comprehensive understanding of your website’s performance. Potential problems can hinder data flow, making it difficult to interpret results accurately. These problems can manifest in several ways, from missing data to incorrect metrics.
Troubleshooting Connectivity Problems
Troubleshooting connectivity issues involves a systematic approach to identify and resolve problems between the two platforms. Start by verifying that your website properties are correctly configured in both platforms. Ensure that the proper tracking code is implemented and that the data streams are not blocked.
Diagnosing and Resolving Data Discrepancies
Data discrepancies between Search Console and Analytics require careful diagnosis. Review the timeframes of data collection in both platforms. Potential discrepancies could arise from different reporting periods or from issues with the data collection process. If you notice missing data, investigate the data collection frequency and timeframes in both platforms.
Potential Reasons for Missing or Inaccurate Data
Several factors can lead to missing or inaccurate data in your integrated reports. Incorrect implementation of the tracking code or configuration errors can result in data not being correctly captured or processed. Technical issues with the platforms themselves, such as temporary outages, can also contribute to data inconsistencies.
Identifying and Correcting Configuration Errors
Configuration errors are a common source of data synchronization issues. Ensure that the property settings in both platforms are correctly matched and that the tracking code is properly implemented. Double-check the URLs, user segments, and any other parameters that could be misconfigured. Regularly review and update configurations to prevent future issues.
Table of Potential Connection Errors and Solutions
| Connection Error | Possible Cause | Solution |
|---|---|---|
| Missing data in Google Analytics | Incorrect tracking code implementation or blocked data streams | Verify tracking code implementation. Ensure no data streams are blocked. Check for any recent updates or changes in website code. |
| Data discrepancies in reporting | Different reporting periods or data collection frequency | Ensure consistent reporting periods. Verify data collection frequency and timeframes. Review any filters or segments in place. |
| Synchronization issues | Configuration errors in either Search Console or Analytics | Verify property settings match. Ensure proper implementation of tracking code. Double-check the URLs and other parameters. |
| Data not updating | Technical issues with the platforms | Check for any platform outages or maintenance. If the issue persists, contact Google support. |
Optimizing Website Content Based on Data
Unlocking the full potential of your website involves more than just creating compelling content. It requires a deep understanding of how your audience interacts with it and how search engines perceive it. Combining data from Google Search Console and Analytics provides a powerful toolkit to identify areas for improvement and optimize your content for better search engine rankings and increased user engagement.
Leveraging Combined Data for Content Updates
Integrating Search Console and Analytics data allows a comprehensive view of your website’s performance. Search Console highlights s driving traffic, while Analytics reveals user behavior on your pages. This dual perspective offers invaluable insights into what content resonates with your audience and what needs adjustment. By analyzing both, you can create content that aligns with user intent and search engine expectations, fostering a positive user experience and improved rankings.
Improving Search Engine Rankings Through Data Analysis
A key aspect of optimization is identifying high-performing s and understanding their search volume and competition. Analyze which s drive the most organic traffic and focus on creating content that targets these terms. For instance, if a particular consistently brings in high-volume traffic but your website ranks lower than expected, the content might need a more comprehensive approach.
This could involve incorporating more relevant s, adding more value to the content, or restructuring the content for better readability. Another example is a with low search volume, but your website is still ranking well. This could indicate a niche audience that’s highly engaged with your content, and optimization efforts might be focused on providing even more value for this segment.
Strategies for Improving Content Based on Search Query Data and User Behavior, Connect google search console analytics
Understanding user behavior is paramount. Analyze the bounce rate, time spent on page, and click-through rate (CTR) for specific pages. High bounce rates might suggest content that doesn’t address user intent. Conversely, pages with high time on page and low bounce rates indicate content that resonates well. Combine this with search query data from Search Console to identify specific search queries and refine your content to match the user’s intent more precisely.
For instance, if a specific query often leads to a high bounce rate, consider revising the page’s title, meta description, or content itself to better address the user’s need. This refinement will make the content more relevant and engaging, thereby improving search engine rankings and user experience.
A/B Testing Content Changes and Analyzing Their Impact on Search Performance
Testing different content variations is crucial for optimization. A/B testing involves comparing two versions of a page (A and B) to determine which performs better. Key elements to test include headlines, calls to action, image placement, and even different writing styles. This data-driven approach lets you measure the impact of changes on key metrics like click-through rate and conversion rate.
Connecting Google Search Console analytics is crucial for understanding your site’s performance. Knowing your site’s traffic and search rankings helps you identify potential issues. This data is essential for preventing content theft, and using tools like those available at keep content thieves away can help. Ultimately, a strong understanding of your Search Console data will empower you to take proactive steps against those who might try to steal your content.
A significant increase in CTR might signal an improved title or call to action that resonates with users, while a decrease in bounce rate could indicate more engaging content.
Connecting Google Search Console analytics is crucial for understanding website performance. Knowing how Google AI interprets user clicks and traffic patterns, as detailed in google ai overviews clicks traffic impact , is key to optimizing your strategy. This insight directly informs how you adjust your SEO approach and content for better results in search engine rankings.
Content Optimization Strategies Based on Data Analysis
| Metric | Analysis | Optimization Strategy |
|---|---|---|
| High Bounce Rate | Content doesn’t meet user expectations | Revise content to align with search queries, improve clarity, and enhance user experience. |
| Low Time on Page | Content lacks engagement | Add more interactive elements, improve readability, and provide more in-depth information. |
| High CTR | Content is attractive and relevant | Maintain the successful format and expand on the topic with more detailed information. |
| High Conversion Rate | Content effectively converts visitors | Duplicate the successful format on other pages to increase conversions. |
Advanced Reporting and Visualization
Unlocking the true potential of your website data often requires more than just basic metrics. Advanced reporting and visualization techniques allow you to delve deeper into the insights hidden within your Search Console and Analytics data, revealing actionable patterns and trends. This powerful combination empowers informed decision-making, leading to optimized content strategies and increased website performance.Combining Search Console and Analytics data enables a comprehensive view of user behavior and search engine performance.
Visualizations help to interpret this complex data in a digestible format, highlighting crucial relationships between search queries, user interactions, and website traffic.
Data Visualization Techniques for Combined Data
Effective data visualization is key to extracting actionable insights. Techniques like interactive charts, heatmaps, and trend lines provide a dynamic and engaging way to explore the relationships between different data points. For example, a heatmap showing the click-through rate (CTR) for different search queries across various devices can reveal patterns in user behavior and preferences. Trend lines illustrate the evolution of key metrics over time, highlighting seasonal variations or long-term growth trends.
Creating Custom Reports
Custom reports allow you to focus on specific metrics relevant to your business goals. These reports can be tailored to track key performance indicators (KPIs) like conversion rates, bounce rates, or average session duration, all in relation to specific search queries. For instance, a custom report could track the performance of specific blog posts in relation to their organic search traffic.
Connecting Google Search Console analytics is crucial for understanding your website’s performance. Knowing where your traffic is coming from helps you refine your strategy, and that’s where a deep dive into lead generation form optimization comes in handy. For example, if you’re not seeing the expected conversions, the definitive guide to lead generation form optimization provides actionable tips on improving your forms, ultimately boosting your website’s overall performance and the data you see in Google Search Console.
By combining form optimization with insights from Search Console, you can really unlock your site’s potential.
This would provide detailed insights into the effectiveness of content strategies.
Using Dashboards to Track Key Metrics
Dashboards provide a central hub for monitoring key metrics and tracking progress toward your objectives. They consolidate various data points into a single, easily digestible view. Dashboards can visualize data from both Search Console and Analytics, providing a holistic picture of your website’s performance. They are also easily customizable to accommodate specific needs and objectives.
Role of Data Visualization in Conveying Insights
Effective data visualization goes beyond simply displaying numbers. It’s about communicating insights in a clear, concise, and engaging manner. Visualizations should be designed to highlight patterns, trends, and anomalies that might otherwise be missed in raw data. A well-designed dashboard, for example, can immediately identify a sudden drop in organic traffic or an increase in bounce rates from a specific search query.
Examples of Interactive Dashboards
| Dashboard Type | Functionality |
|---|---|
| Organic Search Performance Dashboard | Tracks key organic search metrics, including impressions, clicks, CTR, and average position for specific s. Provides insights into search query performance and seasonal trends. |
| User Behavior Dashboard | Displays user behavior data, such as pages per session, average session duration, and bounce rate, segmented by different search queries. Identifies high-performing and low-performing pages based on user engagement. |
| Conversion Tracking Dashboard | Tracks conversions from organic search, showing conversion rates for specific s and landing pages. Highlights the most effective search queries driving conversions. |
Customizing Visualizations
Visualizations can be customized to better represent your data and highlight specific insights. Adjusting colors, adding labels, and choosing appropriate chart types can significantly improve the clarity and impact of your visualizations. For example, using different colors for different user segments or using a line graph to show trends over time. Interactive elements, such as drill-down capabilities, allow users to explore the data in greater detail.
Consider using tooltips or pop-ups to provide additional context when users hover over specific data points.
Illustrative Case Studies

Connecting Google Search Console and Analytics unlocks a treasure trove of data, revealing valuable insights into website performance. By analyzing this combined data, businesses can identify areas for improvement, optimize content strategies, and ultimately drive more traffic and conversions. This section will showcase real-world examples of websites that leveraged this integration to achieve significant gains.
E-commerce Website Success Story
A mid-sized e-commerce website, specializing in handcrafted jewelry, saw a noticeable increase in organic traffic after integrating Search Console and Analytics. Initially, their organic traffic was inconsistent, with significant fluctuations. After integrating the data, they discovered that certain product categories were attracting more organic traffic than others. This allowed them to refine their strategy by optimizing the content of underperforming product pages, focusing on high-demand s.
They also discovered that user behavior on specific product pages was suboptimal. This led to improvements in page layout, call-to-action placement, and improved user experience.
Blog Website Improvement
A blog focusing on sustainable living noticed a substantial increase in engagement after integrating Search Console and Analytics. The initial analysis revealed that blog posts focusing on DIY projects and home gardening were driving the most traffic. Further analysis showed that readers spent the longest time on these specific types of posts. Based on this data, the blog expanded its content strategy, creating more detailed tutorials and how-to guides related to these themes.
They also implemented a more user-friendly commenting system and social sharing options. This strategy boosted user engagement and time spent on the site, which further improved search engine rankings.
Analysis Steps for Case Studies
Understanding how to analyze case studies is crucial for extracting actionable insights. The process involves several key steps. First, identify the website’s specific goals and objectives. Next, review the data from Search Console and Analytics, focusing on key metrics such as organic traffic, rankings, and user behavior. Identify any patterns or trends in the data.
Finally, analyze the website’s strategies and tactics to understand how they contributed to the observed results. This systematic approach helps in recognizing best practices and applying them to other websites.
Key Actionable Insights from Examples
Analyzing real-world examples reveals valuable insights. By observing the strategies and tactics used by successful websites, you can adapt and implement similar approaches to your own site. A key insight is that successful optimization often involves a combination of technical , content strategy, and user experience enhancements. Another critical takeaway is the importance of continuous monitoring and analysis.
Websites that consistently monitor their performance and adapt their strategies are more likely to see sustained growth. The data from Search Console and Analytics provides a dynamic view of website performance, allowing for real-time adjustments to strategies.
Closing Summary: Connect Google Search Console Analytics
In conclusion, connecting Google Search Console and Google Analytics provides a powerful synergy for website optimization. By analyzing search performance, identifying traffic sources, and troubleshooting potential issues, you can gain a deeper understanding of user behavior and tailor your content strategy for maximum impact. This guide has equipped you with the knowledge to effectively utilize these platforms, paving the way for improved and increased website success.


