
Build custom reports with Google Ads dashboards, unlocking actionable insights from your ad campaigns. This guide dives deep into creating tailored reports, from understanding dashboard basics to advanced techniques for analyzing performance across various campaigns. We’ll explore how to leverage Google Ads tools to build reports specific to your business goals, ensuring you gain valuable data-driven insights for informed decision-making.
We’ll cover everything from simple dashboards to complex visualizations, providing clear explanations and practical examples along the way. Learn how to tailor reports to different roles, from marketers to sales teams, ensuring everyone in your organization benefits from the data. Discover the key metrics, dimensions, and reporting tools needed to extract maximum value from your Google Ads campaigns.
Introduction to Google Ads Dashboards
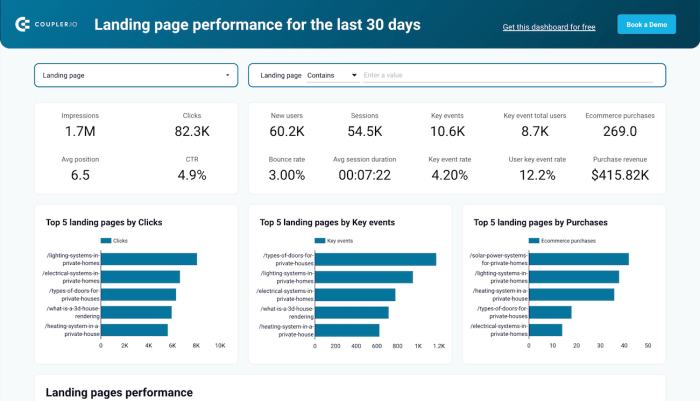
Google Ads dashboards are powerful tools for visualizing and analyzing your advertising performance. They transform raw data into actionable insights, allowing you to track key metrics, identify trends, and optimize your campaigns for maximum ROI. These dashboards provide a centralized view of your entire Google Ads account, making it easier to understand the impact of different strategies and make informed decisions.Dashboards are dynamic, interactive representations of your advertising data.
They offer a high-level overview, enabling quick identification of key performance indicators (KPIs) and areas needing attention. Instead of sifting through numerous reports, you can get a comprehensive picture of your campaign health at a glance.
Dashboard Types and Applications
Different dashboard types cater to specific needs and campaign objectives. A basic dashboard might focus on overall campaign performance, while a more complex one could drill down into specific ad groups or s. This variety allows you to tailor the dashboard to your requirements. For example, a small business might use a dashboard primarily for tracking overall campaign spend and conversion rates.
A larger company with more complex campaigns could use dashboards to analyze performance at the granular level of individual ad copy variations.
Key Metrics and Dimensions
Dashboards typically display a variety of metrics and dimensions. Metrics quantify the performance of your campaigns, while dimensions categorize the data, such as specific ad groups, s, or geographic locations. Essential metrics include click-through rates (CTR), cost-per-click (CPC), conversion rates, and return on ad spend (ROAS). Dimensions help you segment and understand the performance of different parts of your campaigns.
Illustrative Dashboard Layout
The following table presents a simplified layout of a Google Ads dashboard, illustrating common metrics:
| Metric | Description | Example Value |
|---|---|---|
| Clicks | Number of times users clicked on your ads. | 150 |
| Impressions | Number of times your ads were displayed. | 1000 |
| CTR | Percentage of impressions that resulted in clicks. | 15% |
| CPC | Cost you pay each time a user clicks on your ads. | $1.20 |
| Conversion Rate | Percentage of clicks that resulted in desired actions (e.g., purchases, sign-ups). | 5% |
| Cost | Total amount spent on your campaigns. | $180 |
This layout provides a snapshot of your campaign’s performance across various aspects. The metrics displayed will vary depending on the specific dashboard and the metrics you choose to track. The example values are hypothetical and should not be taken as representative of any real-world campaign.
Understanding Report Customization Needs
Crafting insightful Google Ads reports is crucial for effective campaign management. A key aspect of this process is understanding the diverse needs of different stakeholders within your organization. Different departments and individuals will require varying levels of detail and specific metrics, so a tailored approach is essential for maximizing the value of your reporting.Understanding these needs allows you to create reports that are not just informative but also actionable.
Building custom reports in Google Ads dashboards is a game-changer for analyzing your campaigns. But, to truly optimize your strategy, you need the right tools to manage your overall digital marketing efforts. For example, understanding which platform is best for your needs—Spekit, HelpScout, or UserPilot—is crucial. This comparison helps you choose the best fit for your specific business goals, like identifying the ideal digital marketing tool for boosting conversions.
To dive deeper into this decision-making process, check out this in-depth comparison of which is the best digital marketing tool spekit vs helpscout vs userpilot an indepth comparison. Ultimately, the right digital marketing tools, like those in this comparison, will empower you to build even more insightful Google Ads reports.
This translates into better decision-making, improved campaign performance, and ultimately, a higher return on investment. By addressing the specific needs of different user roles, you empower them to make data-driven decisions and contribute to the overall success of your marketing efforts.
Identifying Reporting Requirements for Different Business Goals
Different business objectives require different reporting metrics. For example, a company focused on brand awareness might prioritize impressions and reach metrics, while an e-commerce business emphasizing sales conversions will concentrate on click-through rates, conversion rates, and revenue generated. Accurate reporting directly supports these goals, enabling adjustments to campaigns based on the data.
Tailoring Reports to Specific Audiences
Creating reports for different audiences necessitates tailoring the presentation to their specific needs. Marketers might require granular data on performance and ad copy variations, while sales teams might need reports highlighting the revenue generated from specific ad campaigns or landing pages. A clear understanding of each audience’s priorities ensures that the reports are relevant and useful.
Comparing and Contrasting Reporting Needs of Different Roles
Different roles within a business have distinct needs when it comes to Google Ads reporting. Marketers need a deep dive into campaign performance metrics, enabling them to optimize ad copy, bidding strategies, and targeting. Sales teams, on the other hand, might be more interested in reports that show the revenue generated from specific campaigns or landing pages. Analyzing the performance of these key metrics in conjunction with sales data is crucial.
Organizing Reporting Needs by User Role
| User Role | Specific Reporting Needs |
|---|---|
| Marketers | Detailed performance metrics for each campaign, including performance, ad copy variations, conversion rates, and cost-per-acquisition. Data visualization should clearly demonstrate the impact of different strategies and campaigns. |
| Sales Teams | Reports focused on revenue generated from specific ad campaigns or landing pages. Reports should correlate ad performance with sales data to highlight the direct impact of campaigns on revenue generation. Visualizations should directly show revenue attribution. |
| Finance Teams | Reports highlighting campaign ROI, cost-per-acquisition (CPA), and overall budget performance. These reports should be concise and easily understandable, providing key financial metrics. |
| Executive Leadership | High-level summaries of campaign performance, key metrics, and overall ROI. These reports should provide a clear overview of the effectiveness of the Google Ads strategy and its contribution to the business goals. |
Building Custom Reports from Google Ads Data
Unleashing the full potential of your Google Ads campaigns often requires more than just the default reports. Custom reports allow you to drill down into specific aspects of your performance, revealing hidden trends and actionable insights. This empowers data-driven decision-making, optimizing campaigns for better ROI. This section dives deep into the process of crafting these tailored reports.Custom reports in Google Ads aren’t just about selecting different metrics; they’re about meticulously structuring data to reveal meaningful patterns.
This involves understanding how to choose the right metrics and dimensions, and then organizing the data in a clear, understandable format. The key is to focus on the information most relevant to your specific campaign goals.
Selecting Metrics and Dimensions
Choosing the right metrics and dimensions is crucial for a custom report that accurately reflects your campaign’s performance. Metrics quantify aspects like clicks, conversions, cost, and revenue. Dimensions categorize data, such as date, device, location, or . By combining relevant metrics and dimensions, you create a more focused and actionable report. For instance, tracking conversion rates by device type reveals if mobile users are converting at a different rate than desktop users.
This insight allows you to adjust your targeting or ad creatives accordingly.
Configuring Your Custom Report
Within the Google Ads interface, navigating to the “Reports” section and selecting “Custom” provides the starting point. From there, you can select the specific date range, metrics, and dimensions you need. The Google Ads interface allows for complex combinations of criteria, enabling detailed analysis. It’s essential to understand the available filters and how to apply them effectively to isolate specific data points.
Carefully consider which metrics and dimensions will most effectively address your business questions.
Structuring Your Report for Clarity
A well-structured custom report is more than just a collection of data; it’s a tool for understanding trends. The layout significantly impacts comprehension. Use clear headings, descriptive labels, and appropriate visualizations (charts, tables). For example, a table displaying conversion rates by source can highlight which channels are performing best. Consider adding trend lines or annotations to highlight key changes in performance.
Ensure that the presentation facilitates easy interpretation, enabling quick identification of critical insights.
Example Custom Report Structures
| Report Type | Metrics | Dimensions | Purpose |
|---|---|---|---|
| Conversion Performance by Campaign | Conversions, Cost per Conversion, Conversion Rate | Campaign Name, Date, Device | Identifying high-performing and underperforming campaigns based on conversions and cost-per-conversion. |
| Performance Analysis | Clicks, Impressions, CTR, Cost-per-Click (CPC) | , Ad Group, Date | Analyzing the effectiveness of specific s, identifying opportunities to improve bids or ad copy. |
| Geographic Targeting ROI | Conversions, Revenue, Cost | Location, Date, Campaign | Evaluating the return on investment (ROI) of different geographic regions for your campaigns. |
Leveraging Google Ads Reporting Tools: Build Custom Reports With Google Ads Dashboards

Beyond the basic dashboards, Google Ads offers powerful tools for digging deeper into your campaign performance. Mastering these tools allows for more precise analysis, identification of trends, and ultimately, better campaign optimization. This section explores the core features within Google Ads that enable custom report creation.Effective reporting goes beyond simply viewing numbers. By utilizing the available tools and features, you can isolate key performance indicators (KPIs), segment your audience, and tailor your analysis to specific timeframes.
This granular control empowers you to answer critical questions about your campaigns and make data-driven decisions.
Building custom reports in Google Ads dashboards is a game-changer for analyzing your campaigns. Understanding your data is crucial, and crafting these reports can reveal hidden trends. To truly optimize your marketing efforts, you need a solid content marketing strategy, like the 8 essential steps outlined in content marketing 8 essential steps for effective implementation.
This will ensure your reports are not just pretty visuals, but actionable insights. Ultimately, these reports, backed by a strong content marketing plan, will drive better ROI for your Google Ads campaigns.
Available Reporting Tools
Various tools within Google Ads provide a structured approach to report creation. These tools offer pre-built reports and the flexibility to craft custom analyses, facilitating a deep dive into campaign performance.
- Campaign Summary Report: This report offers a high-level overview of your campaign performance across various dimensions, including clicks, impressions, and conversions. It’s a starting point for understanding overall campaign health.
- Performance Reports: These reports provide detailed insights into individual s, ad groups, and campaigns. This level of granular detail enables identification of high-performing and underperforming aspects, allowing for focused optimization efforts.
- Conversion Reports: These reports focus specifically on conversions, giving you a detailed breakdown of how users interact with your ads and complete desired actions. They’re crucial for understanding the effectiveness of your campaigns in driving conversions.
- Attribution Reports: Crucially, attribution reports track the entire customer journey, attributing conversions to different touchpoints, including ad interactions. This understanding of the path to conversion allows you to identify which parts of the process need improvement.
Using Filters and Segments
Filters and segments are essential for isolating specific data points and revealing nuanced insights. They refine your view of the data, helping you identify trends and patterns that might otherwise be hidden.
- Filters: Filters allow you to narrow down your data by criteria such as date ranges, locations, devices, or s. For example, you can filter to view only mobile conversions from the past month. This targeted approach isolates specific data sets for deeper analysis.
- Segments: Segments provide additional granularity by grouping your data based on specific characteristics like conversion value, customer demographics, or campaign type. This enables comparison of different segments, such as high-value versus low-value conversions.
Custom Date Ranges and Timeframes
Defining the appropriate date range is critical for meaningful analysis. Customizable timeframes allow you to analyze performance over specific periods, like a particular quarter or a custom date range.
- Flexibility in Timeframes: Google Ads dashboards offer the ability to analyze data over various timeframes, from daily to yearly. This flexibility is vital for identifying trends and patterns across different time horizons.
- Trend Identification: Analyzing data over custom date ranges allows for the identification of trends and seasonality in your campaign performance. This is useful for adjusting your strategies to match peak demand periods.
Comparison of Reporting Tools
The table below summarizes the features of different Google Ads reporting tools, highlighting their unique applications:
| Reporting Tool | Key Features | Use Cases |
|---|---|---|
| Campaign Summary Report | High-level overview of campaign performance; quick summary of key metrics | Initial assessment of campaign health; identification of potential issues |
| Performance Reports | Detailed insights into individual campaigns, ad groups, and s; granular analysis | Identifying high-performing and underperforming aspects; optimizing campaigns |
| Conversion Reports | Detailed breakdown of conversions; understanding the user journey | Analyzing conversion rates; identifying areas for improving conversion funnels |
| Attribution Reports | Tracking the entire customer journey; understanding the role of different touchpoints | Identifying the effectiveness of various marketing channels; optimizing the customer journey |
Implementing Custom Report Designs
Crafting custom reports in Google Ads dashboards goes beyond simply pulling data; it’s about presenting it in a way that’s insightful and actionable. Effective design choices significantly impact how you understand trends, spot opportunities, and make informed decisions. This section delves into methods for formatting and presenting custom reports for maximum impact.
Formatting for Clarity and Readability
To maximize the usefulness of your custom reports, clear formatting is crucial. Employ consistent fonts, colors, and layouts. Use headings and subheadings to structure the report logically, guiding the reader through the key takeaways. Visual hierarchy, achieved through varying font sizes and colors, should emphasize important data points. Applying proper spacing and white space prevents visual clutter, enhancing readability.
Think of the report as a story—it should unfold in a way that’s easy to follow.
Visualizing Data for Insightful Interpretation
Visualizations are powerful tools for interpreting data. They transform complex numbers into easily digestible insights. The right chart type can quickly reveal trends, patterns, and outliers that might be missed in raw data. Choosing appropriate visualization techniques is essential to understanding the narrative within your data.
Examples of Effective Visualizations
Line charts are excellent for illustrating trends over time, such as the growth of conversions or the fluctuation of cost per click (CPC). Bar charts effectively compare different categories or segments, allowing for rapid identification of high-performing campaigns or top-performing s. Pie charts are ideal for showcasing proportions or market share. A scatter plot, on the other hand, can display the correlation between two variables, like ad spend and conversions.
A combination chart, combining elements of different chart types, can provide a multifaceted view of the data. For example, a combination chart might overlay a line chart of total revenue with a bar chart of cost per acquisition (CPA) to show the relationship between these metrics over time.
Chart Selection Guidelines
| Chart Type | Data Suitability | Example Use Case |
|---|---|---|
| Line Chart | Tracking trends over time | Displaying monthly conversion rates |
| Bar Chart | Comparing categories or segments | Comparing click-through rates (CTR) across different ad groups |
| Pie Chart | Illustrating proportions | Showing the distribution of clicks across different ad platforms |
| Scatter Plot | Identifying correlations | Analyzing the relationship between ad spend and return on ad spend (ROAS) |
| Combination Chart | Presenting multiple metrics simultaneously | Overlaying a line chart of impressions with a bar chart of click-through rates |
Best Practices for Custom Report Creation

Crafting custom reports in Google Ads dashboards is powerful, but requires careful attention to detail. A well-designed custom report is more than just a collection of data; it’s a strategic tool for understanding campaign performance and driving actionable insights. By adhering to best practices, you can ensure your reports are accurate, insightful, and ultimately beneficial to your marketing strategy.
Common Pitfalls and Errors to Avoid
Custom reports are prone to errors if not meticulously planned. Inaccurate data entry, poorly defined metrics, and inappropriate visualizations can lead to misleading conclusions. Incorrectly linked dimensions and metrics result in inaccurate summaries. Overly complex report structures can make it difficult to interpret data and miss crucial patterns. Also, failing to account for seasonality or external factors can skew the interpretation of results.
Maintaining Data Accuracy and Consistency
Data accuracy is paramount. Ensure your chosen metrics and dimensions accurately reflect the insights you’re seeking. Double-check your data sources and filter criteria to avoid unintended omissions or inclusions. Establish clear naming conventions for fields and metrics to ensure consistency across different reports. Regularly review and update your report formulas to maintain relevance and prevent errors.

Implementing data validation rules can help catch errors early on.
Building custom reports with Google Ads dashboards is super helpful, but expanding your reach might mean exploring other options. For example, consider running Microsoft Advertising alongside Google Ads for wider audience targeting, which can offer unique insights. Checking out 3 reasons to run Microsoft advertising alongside Google Ads could give you some valuable ideas on how to potentially improve your reporting.
Ultimately, this helps in tailoring those custom Google Ads reports to capture a broader range of data.
Creating Actionable and User-Friendly Reports
A report’s value is measured by its ability to inspire action. Use clear and concise visualizations. Avoid clutter and unnecessary data points. Include relevant context, like historical trends or industry benchmarks. Provide clear explanations of key findings and actionable recommendations.
Prioritize simplicity and readability. Consider the intended audience when designing the report and tailor the language and visualizations accordingly. Employ interactive elements to allow users to explore the data dynamically.
Creating a Profitability-Focused Custom Report
A profitability-focused report provides a detailed analysis of campaign ROI. This type of report goes beyond just clicks and impressions to calculate the true impact of your campaigns on your bottom line.
- Define Key Metrics: Include revenue generated, cost per acquisition (CPA), and return on ad spend (ROAS). These metrics provide a holistic view of profitability.
- Segment Data Effectively: Segment campaigns based on profitability, conversion rates, and customer demographics. This allows for granular analysis of each campaign’s performance.
- Calculate Profitability Metrics: Develop custom formulas for key profitability metrics such as profit margin and cost of acquisition. For example, if ‘revenue’ is your primary revenue source, the formula for profit margin could be `(Revenue – Cost)/Revenue`.
- Visualize Data Insightfully: Use charts and graphs to illustrate the relationship between key metrics. For instance, a line graph could display ROAS over time. A bar chart could compare profitability across different campaigns.
- Implement Filters and Segments: Use filters to isolate specific campaign data for in-depth analysis, like those for a particular product category or time period.
- Provide Actionable Insights: Identify trends and patterns, such as high-performing campaigns or areas for improvement in cost management. For example, a high ROAS from a specific campaign suggests potential for optimization or expansion of this campaign.
Advanced Custom Reporting Techniques
Mastering Google Ads dashboards goes beyond basic reporting. Advanced techniques unlock deeper insights, allowing you to analyze performance across multiple dimensions and identify nuanced trends. This section delves into calculated columns, custom segments, and sophisticated comparisons to extract the most value from your data.Calculated columns and custom formulas are powerful tools for creating new metrics directly from existing data.
This allows you to derive insights not readily available in standard reports, like lifetime value or cost per conversion at different stages of the customer journey.
Calculated Columns and Custom Formulas, Build custom reports with google ads dashboards
Calculated columns are dynamic fields that compute values based on other columns in your report. They are essential for performing complex calculations and creating custom metrics. Formulas are used to define the calculations, allowing you to combine, aggregate, and manipulate existing data in the report.
- Example 1: Calculate the Average Order Value. This metric can be derived from the sum of order values and the number of orders within a specified time frame. The formula might be
(SUM(Order Value)) / (COUNT(Orders)). - Example 2: Determine Return on Ad Spend (ROAS) by dividing total revenue by total ad spend. This metric helps evaluate the profitability of your campaigns. The formula could be
(SUM(Revenue)) / (SUM(Cost)). - Example 3: Create a Conversion Rate for each ad group by dividing the number of conversions by the number of clicks within each group. This formula might be:
(COUNT(Conversions)) / (COUNT(Clicks)).
Custom Segments and Filters
Custom segments and filters allow you to narrow down your data and focus on specific subsets of your audience or campaigns. This enables you to analyze performance in highly targeted contexts.
- Custom Segments: These let you group data based on criteria beyond the standard categories. For example, segment users who visited a specific landing page or clicked on a particular ad. This allows you to isolate the performance of particular campaigns or customer groups.
- Custom Filters: These allow you to filter data based on specific criteria. For instance, you could filter for conversions that occurred within a certain timeframe or only include data from a specific location. This provides a more precise analysis of the data you are evaluating.
Comparing Performance Across Campaigns
A crucial aspect of reporting is comparing the performance of different campaigns. This comparison highlights strengths, weaknesses, and areas for improvement in your campaigns.
- Using Calculated Columns: You can create calculated columns for metrics like ROAS or CPA for each campaign to directly compare their performance. This allows for a quick and efficient evaluation.
- Custom Segments: Create segments for each campaign. This way you can compare specific groups and analyze performance within those campaigns individually, in detail.
- Visualizations: Use charts and graphs to visualize the differences in performance across campaigns. This allows for a rapid and clear identification of trends.
- Example: Create a report comparing the ROAS of different campaigns, filtering for conversions within the last 30 days. Use a bar chart to compare the values. This enables a quick visual assessment of campaign effectiveness.
Troubleshooting and Common Issues
Custom reports in Google Ads dashboards can be powerful tools, but creating them can sometimes be challenging. Understanding potential pitfalls and troubleshooting strategies is crucial for successful report development. This section delves into common problems and provides actionable solutions to help you navigate the process smoothly.
Common Report Errors and Solutions
Troubleshooting custom reports often involves identifying the root cause of errors. Incorrect data input, poorly constructed formulas, or incompatibility with specific reporting features can all lead to unexpected results. By systematically checking various aspects of your report setup, you can isolate and resolve these issues.
| Error Message | Potential Solutions |
|---|---|
| “Invalid formula” | Double-check the syntax of your formula, ensuring all operators and functions are used correctly. Refer to Google Ads’ formula documentation for specific syntax rules. Verify that you’re using valid field names and referencing the correct data sources. |
| “Data not found” | Ensure the data you’re referencing exists in your Google Ads account. Double-check the date range, ad group or campaign selections, and any filters applied. Verify the correct field names are used in the formula. |
| “Report generation failed” | Confirm your report has not exceeded the Google Ads API request limits. If the issue persists, try refreshing the page or re-running the report. If the problem continues, contact Google Ads support. |
| “Invalid field name” | Review the spelling and capitalization of field names in your report. Use the correct field names as documented in the Google Ads reporting API. If you’re referencing custom metrics, ensure they are properly defined in your account. |
Data Discrepancies
Differences between expected and actual report data often stem from unrecognized filters, incorrect date ranges, or incompatible data sets. By carefully examining your report settings and data sources, you can identify and rectify discrepancies. A thorough understanding of data relationships is crucial to pinpointing the source of any inconsistencies.
- Incorrect Date Ranges: Ensure the date range you’ve selected in your report aligns with the data you intend to analyze. Incorrect selections can lead to incomplete or inaccurate data sets.
- Unintended Filters: Review the filters applied to your report. Unintentional filters might be excluding relevant data points, causing discrepancies in the results. Verify that filters are accurately reflecting your analysis goals.
- Data Source Compatibility: Ensure the different data sources in your report are compatible. If you’re combining data from various campaign types or ad groups, check that the data formats and structures align. This step helps in avoiding inconsistencies that arise from conflicting data structures.
Troubleshooting Techniques
To effectively troubleshoot report errors, systematic investigation is essential. Start by reviewing the report’s structure, ensuring that all data elements are properly linked and referenced. Then, verify the accuracy of the data source, ensuring that it corresponds to the intended analysis.
- Verify Data Source: Check that the data source is correctly identified and includes the required data elements. Double-check the data source is properly configured and the report is accessing the right dataset.
- Isolate the Issue: Try simplifying the report by removing complex formulas or filters to pinpoint the problematic section. Start with the simplest version of your report to isolate the source of the issue. Begin by using simpler data sets to identify if the problem stems from a specific field, formula, or filter.
- Review Documentation: Consult the Google Ads reporting documentation for any specific issues or guidance on solving report-related problems. This step often provides detailed information about the report format, data structure, and other crucial details.
Closing Summary
In conclusion, building custom reports with Google Ads dashboards empowers you to extract the full potential of your advertising data. By understanding the basics, tailoring reports to specific needs, and leveraging advanced techniques, you can transform raw data into actionable insights. This guide provides a comprehensive roadmap to creating reports that are not only informative but also practical and user-friendly, driving better results for your business.


